By Himanshu Khantwal · Published October 19, 2026 · Last updated October 19, 2026 · 514 statistics from 16 sources
The short answer: “Sales pay” is two markets under one job title. In the US, the median rep selling technical and scientific products earned $104,920 in May 2025. That is about 46% more than the median rep selling everything else in wholesale and manufacturing ($72,080), and more than double the all-occupation median of $50,980. In B2B software, the number everyone quotes is on-target earnings, and the median account executive’s is $200,000. Half of it is base and half is variable, and only 48% of AEs hit the quota that pays out the variable half. Pay growth for sales roles has also cooled: 2.0% over the 12 months to June 2026, against 3.3% for private-industry workers as a whole.
This page collects 514 data points from 16 primary sources run by 11 publishers, and every table says where its numbers came from. It is a synthesis of other organisations’ research. Sales Vantage ran no survey, and nothing here comes from our placements or clients. Read the surveys with care. Bridge Group’s SDR sample is 83% SaaS, 44% of Xactly’s respondents are B2B technology companies, Pavilion covers B2B tech go-to-market roles, and RepVue is self-reported by users of a tech-leaning review site. The government sources (BLS, ONS, Job Bank) cover whole labour markets. For the hiring side of the story, see our companion piece, Sales Hiring Statistics 2026.
Key takeaways
- $104,920 is the median wage for US technical and scientific products reps, $32,840 above other wholesale and manufacturing reps ($72,080). (BLS OEWS, May 2025)
- $148,270 is the median for sales managers; the 90th percentile is $290,540. (BLS OEWS, May 2025)
- $200K median AE on-target earnings, up from $190K in 2024, against a median quota of $960K. (Bridge Group, 2026, 158 B2B companies)
- 48% of AEs hit quota in 2026 (51% in 2024). For SDRs it is 60%, the lowest the study has recorded. (Bridge Group, 2026 and 2025)
- 50 / 50 is the median AE pay split between base and variable; SDRs run about 65 / 35. (Xactly, 2023 data, 230 B2B companies, tech-heavy)
- 2.0% is how much total compensation for US sales and related occupations grew in the 12 months to June 2026, against 3.3% for all private-industry workers. (BLS ECI)
- 3.6% is the average salary increase budget employers reported for 2026 and project for 2027. (WorldatWork, all employee types)
- 52% of US job postings on Indeed showed a pay range in August 2026, up from 14% in January 2020; the Sales sector is at 51%. (Indeed Hiring Lab)
- 76% of reps wish they had more transparency into how their compensation is calculated. (Salesforce, 2025 data, 4,050 reps)
Jump to a section
- How to read these numbers
- Headline benchmarks
- Pay by sales role (BLS)
- Pay by industry
- Pay by state
- B2B on-target earnings
- Quota and attainment
- Pay mix and plan design
- Pay growth and budgets
- Sales leaders and executives
- Pay transparency
- Why reps leave
- UK and Canada
- Job outlook
- Offer Check: a Sales Vantage framework
- Methodology and sources
- FAQ
How to read these numbers
- OTE is a target, not a paycheque. BLS wages are what people were actually paid, commissions included. Survey OTE is what a plan pays at 100% of quota. Don’t subtract one from the other and call it a “gap”.
- “At quota” is a headcount. 48% of AEs at quota does not mean the average AE reaches 48% of quota. The other 52% might sit at 95% or at 20%, and these studies mostly don’t say.
- Different sources, different biases. BLS and ONS come from employer records. Bridge Group and Xactly come from company leaders. RepVue comes from reps who chose to post their pay. Compare numbers inside a source before you compare across them.
- Flagged samples. Bridge Group SDR (83% SaaS), Xactly (44% B2B technology), Pavilion (tech go-to-market, self-reported) and RepVue (self-reported, tech-leaning) are skewed toward software. The label sits under each table.
- Dates. The year beside each statistic is the year the data describes. Anything from 2022 or earlier carries an Older data tag.
- Derived numbers. Where we divided, subtracted or counted, the cell says “derived” or the text says what we did. The verification sheet lists the arithmetic. Nothing derived is passed off as a publisher’s own figure.
- Job counts differ by source. BLS OEWS counts technical and scientific products reps at 284,800 (a May 2025 survey estimate). The Handbook’s base-year figure is 292,000. Both are BLS, and they are measured differently.
Headline benchmarks at a glance
| Metric | Finding | Role or population | Data year | Source | Sample |
|---|---|---|---|---|---|
| Median wage, technical sales reps | $104,920 | US wholesale and manufacturing, technical and scientific products | 2025 | BLS OEWS | Government survey of employers |
| Median wage, sales managers | $148,270 | US, all industries | 2025 | BLS OEWS | Government survey of employers |
| Median AE on-target earnings | $200K ($190K in 2024) | B2B companies | 2026 | Bridge Group AE 2026 | 158 companies |
| AE pay split, base / variable | 50 / 50 median | B2B companies, 44% technology | 2023 | Xactly 2024 | 230 companies, tech-heavy |
| AEs at quota | 48% (51% in 2024) | B2B companies | 2026 | Bridge Group AE 2026 | 158 companies |
| SDR on-target earnings | $80K, 68:32 split | B2B companies, 83% SaaS | 2025 | Bridge Group SDR 2025 | 351 companies, SaaS-heavy |
| Median AE quota | $960K (4.6x OTE) | B2B companies | 2026 | Bridge Group AE 2026 | 158 companies |
| Pay growth, sales and related | 2.0% vs 3.3% all workers | US private industry, 12 months to June | 2026 | BLS ECI | Government survey of employers |
| Salary increase budget | 3.6% for 2026 and 2027 | All employee types, US | 2026 | WorldatWork SBS | 1,799 organisations |
| Postings that show pay | 52% (US, August) | Indeed postings; Sales sector 51% | 2026 | Indeed Hiring Lab | Job-posting data |
| Reps wanting more pay transparency | 76% | Sales professionals, 22 countries | 2025 | Salesforce 2026 | 4,050 reps, vendor panel |
| Median pay, sales accounts and BD managers | £57,625, £8,019 incentive | UK full-time employees | 2025 | ONS ASHE | 1% payroll sample |
Technical sellers out-earn other reps by $32,840 a year at the median
The short version: where a rep sits on the ladder moves pay far more than a year of growth does. Sales management and technical selling sit at the top of the US table. Retail and real estate sit at the bottom.
Start with the only dataset that covers every employer in the country. The BLS Occupational Employment and Wage Statistics (OEWS) survey reports wages for May 2025, built from employer payroll records pooled over three years, with commissions and production bonuses included. That makes it a better reality check than any OTE survey, because it records pay that was paid, not pay that was promised.
| Occupation (SOC) | Jobs | 10th pct | 25th pct | Median | 75th pct | 90th pct |
|---|---|---|---|---|---|---|
| Sales managers (11-2022) | 637,080 | $73,170 | $100,360 | $148,270 | $207,340 | $290,540 |
| Sales engineers (41-9031) | 51,790 | $73,870 | $92,890 | $124,900 | $161,230 | $195,270 |
| Technical and scientific products reps (wholesale and manufacturing) (41-4011) | 284,800 | $52,600 | $75,030 | $104,920 | $158,160 | $200,440 |
| Securities and financial services sales agents (41-3031) | 489,570 | $48,040 | $56,540 | $78,660 | $129,950 | $212,880 |
| First-line supervisors of non-retail sales workers (41-1012) | 214,390 | $50,320 | $63,940 | $87,520 | $122,050 | $164,070 |
| Other wholesale and manufacturing sales reps (41-4012) | 1,238,190 | $39,090 | $50,470 | $72,080 | $99,640 | $137,550 |
| Services sales reps (41-3091) | 1,256,010 | $37,980 | $47,670 | $69,990 | $100,480 | $148,840 |
| Advertising sales agents (41-3011) | 91,700 | $35,240 | $47,020 | $64,820 | $99,990 | $146,010 |
| Insurance sales agents (41-3021) | 479,100 | $37,330 | $46,870 | $62,280 | $96,950 | $138,140 |
| Real estate sales agents (41-9022) | 193,370 | $32,970 | $40,040 | $52,830 | $82,020 | $123,590 |
| Retail salespersons (41-2031) | 3,897,860 | $27,210 | $29,900 | $35,410 | $38,670 | $47,890 |
| All sales and related occupations (41-0000) | 13,424,300 | $28,080 | $32,440 | $38,530 | $61,100 | $99,850 |
| All US occupations (00-0000) | 155,495,730 | $31,200 | $37,590 | $50,980 | $80,520 | $128,560 |
Source: BLS OEWS. Values read through the BLS Public Data API; series IDs are in the verification sheet. Self-employed people are not counted, which matters most in real estate.
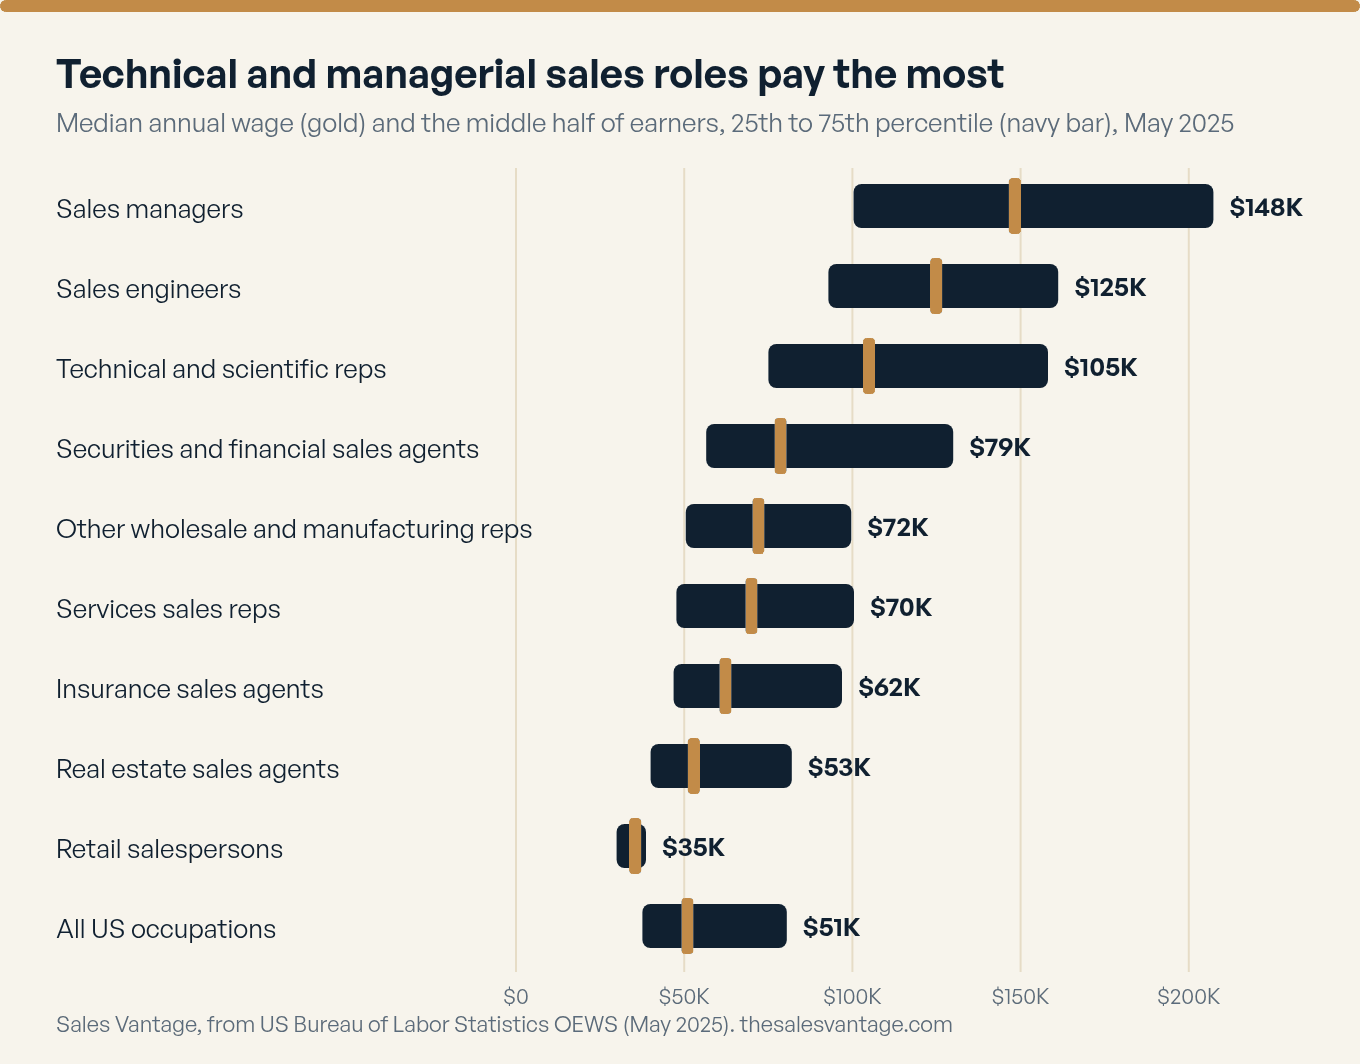
Two things jump out. The distance from top to bottom is huge. A sales manager’s median is more than four times a retail salesperson’s. And inside a single role the spread is just as wide. A technical rep at the 10th percentile made $52,600. At the 90th it was $200,440, a 3.8x spread. Commission does that, and it’s why a median tells a candidate very little about what they will actually take home.
The technical premium is not flat
The BLS splits wholesale and manufacturing reps into those who sell technical and scientific products and everyone else. Same industries, same type of customer, different knowledge. Here is what the split is worth along the pay curve.
| Point on the pay curve | Technical and scientific reps | Other wholesale and manufacturing reps | Gap (derived) |
|---|---|---|---|
| 10th percentile | $52,600 | $39,090 | $13,510 (35% higher) |
| 25th percentile | $75,030 | $50,470 | $24,560 (49% higher) |
| Median | $104,920 | $72,080 | $32,840 (46% higher) |
| 75th percentile | $158,160 | $99,640 | $58,520 (59% higher) |
| 90th percentile | $200,440 | $137,550 | $62,890 (46% higher) |
Source: BLS OEWS. The gap column and percentages are derived (technical rep value minus other rep value).
The premium grows with the pay level, from $13,510 at the 10th percentile to $62,890 at the 90th. The best technical sellers pull away from the pack. Average ones don’t.
What to do with it: If you are setting a base for a technical or engineering-led sales role, don’t benchmark against “sales” in general. The BLS median for the whole sales group is $38,530, and 3.9 million retail salespersons (median $35,410) drag it down. Pull the right row from the table above, then check the industry and state tables below.
Industry moves the number: technical reps make $133,690 in nondurable wholesale
The short version: the same title pays very differently by sector. The gap between technical and non-technical reps is widest in nondurable wholesale and chemicals, and narrowest in medical equipment manufacturing.
| Industry (median annual wage, May 2025) | Technical and scientific reps | Other wholesale and manufacturing reps | Sales engineers | Sales managers |
|---|---|---|---|---|
| Medical equipment and supplies manufacturing | $100,320 | $90,210 | not shown | $169,370 |
| Computer and electronic product manufacturing | $108,260 | $95,870 | $128,980 | $177,360 |
| Chemical manufacturing | $121,130 | $85,630 | not shown | $171,400 |
| Machinery manufacturing | $97,790 | $81,160 | $96,510 | $140,710 |
| Professional, scientific and technical services | $108,100 | $81,670 | $139,990 | $173,700 |
| Merchant wholesalers, durable goods | $98,230 | $67,780 | $107,910 | $144,450 |
| Merchant wholesalers, nondurable goods | $133,690 | $66,940 | not shown | $152,660 |
Source: BLS OEWS. A cell reads “not shown” where BLS reports fewer than 500 jobs for that occupation and industry, because those medians are too thin to quote. Industries are 3-digit NAICS groups.
- $133,690 vs $66,940. Technical reps and other reps in nondurable-goods wholesale, a 2.0x gap, the widest of the seven industries above. BLS OEWS, May 2025
- $100,320 vs $90,210. Technical and other reps in medical equipment and supplies manufacturing, the narrowest gap in the table. Sales managers in the same industry have a median of $169,370. BLS OEWS, May 2025
- $177,360 is the median for sales managers in computer and electronic product manufacturing, the highest manager median in the table. BLS OEWS, May 2025
- $139,990 vs $96,510. Sales engineers in professional, scientific and technical services versus machinery manufacturing. BLS OEWS, May 2025
Sales managers and sales engineers by industry (Handbook)
The Handbook also lists the industries that employ the most people in each occupation, with a median for each. Here are the ones for sales managers and sales engineers.
| Occupation | Industry (BLS top industries by jobs) | Median annual wage, May 2025 |
|---|---|---|
| Sales managers | Finance and insurance | $174,440 |
| Sales managers | Professional, scientific and technical services | $173,700 |
| Sales managers | Manufacturing | $156,150 |
| Sales managers | Wholesale trade | $149,980 |
| Sales managers | Retail trade | $100,000 |
| Sales engineers | Software publishers | $153,410 |
| Sales engineers | Computer systems design and related services | $150,080 |
| Sales engineers | Wholesale trade agents and brokers | $130,310 |
| Sales engineers | Merchant wholesalers, durable goods | $107,910 |
| Sales engineers | Manufacturing | $103,140 |
Source: BLS Handbook
What to do with it: Sales engineers in software publishers earn a median $153,410. In manufacturing the same title earns $103,140, about a third less. If you hire sales engineers away from software, plan for a pay gap that no amount of mission talk will close.
Colorado pays technical reps $135,000. Arkansas pays $71,830
The short version: location still matters for technical sales. The top state median is almost double the bottom one, and Texas, the biggest employer, pays about $25,000 less than California.
BLS publishes state medians for technical and scientific products reps. These are nominal wages with no cost-of-living adjustment, and small states carry few jobs, so we only rank states with 1,000 or more.
| Eight largest states by jobs | Jobs | Median annual wage |
|---|---|---|
| Texas | 44,400 | $99,080 |
| California | 27,590 | $124,220 |
| Florida | 19,840 | $107,700 |
| North Carolina | 11,990 | $125,370 |
| Massachusetts | 11,650 | $118,980 |
| New York | 10,500 | $129,410 |
| Washington | 9,960 | $127,390 |
| Ohio | 9,870 | $108,370 |
| Five highest medians (states with 1,000+ jobs) | Jobs | Median annual wage |
|---|---|---|
| Colorado | 4,150 | $135,000 |
| New Jersey | 5,600 | $131,360 |
| Kansas | 2,440 | $130,850 |
| New York | 10,500 | $129,410 |
| Georgia | 5,700 | $128,850 |
| Five lowest medians (states with 1,000+ jobs) | Jobs | Median annual wage |
|---|---|---|
| Arkansas | 1,520 | $71,830 |
| Oklahoma | 3,970 | $72,480 |
| Wisconsin | 3,390 | $78,480 |
| Nebraska | 1,700 | $84,400 |
| Alabama | 2,780 | $87,140 |
Source: BLS OEWS. Employment and median annual wage for SOC 41-4011, May 2025. Maine, South Dakota and Utah had suppressed values for at least one measure and are left out of the rankings.
Texas employs 44,400 technical reps at a median of $99,080. California has 27,590 and pays $124,220. Colorado tops the list at $135,000, though on a smaller base of 4,150 jobs. The spread between the top and bottom ranked state is $63,170.
What to do with it: A national median hides a lot. When you quote a range to a candidate in New Jersey ($131,360) based on a Midwest benchmark (Wisconsin, $78,480), you will lose them in the first call.
B2B software: the median AE’s on-target earnings are $200,000
The short version: two independent sources, company leaders (Bridge Group) and reps themselves (RepVue), land on the same $200K for AEs. SDRs sit at $80K to $85K.
On-target earnings is base pay plus the variable pay a rep earns at 100% of quota. It is the number most B2B offer letters lead with, and most candidates read it as salary. It isn’t. The quota section below shows why. These tables cover B2B companies, and the SaaS-heavy samples are flagged.
Account executives: Bridge Group, 2026
| Metric | Finding | Context | Data year |
|---|---|---|---|
| Median AE on-target earnings (OTE) | $200K | Up from $190K in 2024; median OTE was $167K in 2022 | 2026 |
| Median AE OTE in 2022 | $167K | The 2022 edition, as restated in the 2026 table | Older data 2022 |
| Median AE quota | $960K | 4.6x quota-to-OTE ratio, up from 4.2x in 2024 | 2026 |
| Median AE quota at SaaS companies | $875K | AI-native, services and physical-goods companies reported higher medians | 2026 |
| Share of AEs at quota | 48% | Down from 51% in 2024; long-term trend is downward | 2026 |
| Ramp time to full productivity | 6.2 months | Highest in the study’s history | 2026 |
| Experience required at hire | 3.7 years | Up from 2.7 years in 2022 | 2026 |
| Experience required at hire in 2022 | 2.7 years | The 2022 edition | Older data 2022 |
| AEs with sole or blended ownership of renewals and expansion | 38% | Nearly doubled since 2024; most common below $25K ASP | 2026 |
| Organisations in the top AI-engagement tercile: reps at quota | 57% | Versus 39% in the lowest tercile; observational, not causal | 2026 |
| Organisations in the lowest AI-engagement tercile: reps at quota | 39% | Same comparison | 2026 |
Source: Bridge Group AE 2026. Sample: 158 B2B companies. The 2022 rows are the older comparison points the publisher gives.
Dividing the two medians gives a quota-to-OTE ratio of 4.8x ($960K over $200K). Bridge Group reports 4.6x, so its headline ratio is not simply one median divided by the other. Either way, quota has grown faster than OTE since 2024, when the ratio was 4.2x. A rep is being asked to carry more revenue for each dollar of target pay.
Pay by role: RepVue, 2026
RepVue publishes what its users report. It covers more roles than the surveys do, and its AE median matches Bridge Group’s. It is self-reported, so treat it as a picture of what reps on the platform say they earn.
| Role (RepVue, mid-2026) | Median base | Median OTE | Top performer | Hitting quota | Base as share of OTE (derived) |
|---|---|---|---|---|---|
| Sales Development Representative | $60,000 | $85,000 | $131,280 | 54.3% | 71% |
| Sales Development Manager | $110,000 | $160,000 | $226,842 | 59.4% | 69% |
| Account Executive | $100,000 | $200,000 | $500,807 | 40.6% | 50% |
| Account Manager | $101,000 | $180,000 | $433,433 | 47.8% | 56% |
| Customer Success Manager | $105,000 | $140,000 | $246,778 | 57.8% | 75% |
| Sales Engineer | $145,000 | $205,000 | $342,727 | 57.1% | 71% |
| Sales Manager | $150,000 | $275,000 | $516,739 | 53.4% | 55% |
| VP of Sales | $200,000 | $380,000 | $779,934 | 65.4% | 53% |
Source: RepVue 2026. Self-reported by RepVue users; sector split not published. Base share of OTE is derived (median base divided by median OTE), so it does not come from RepVue.
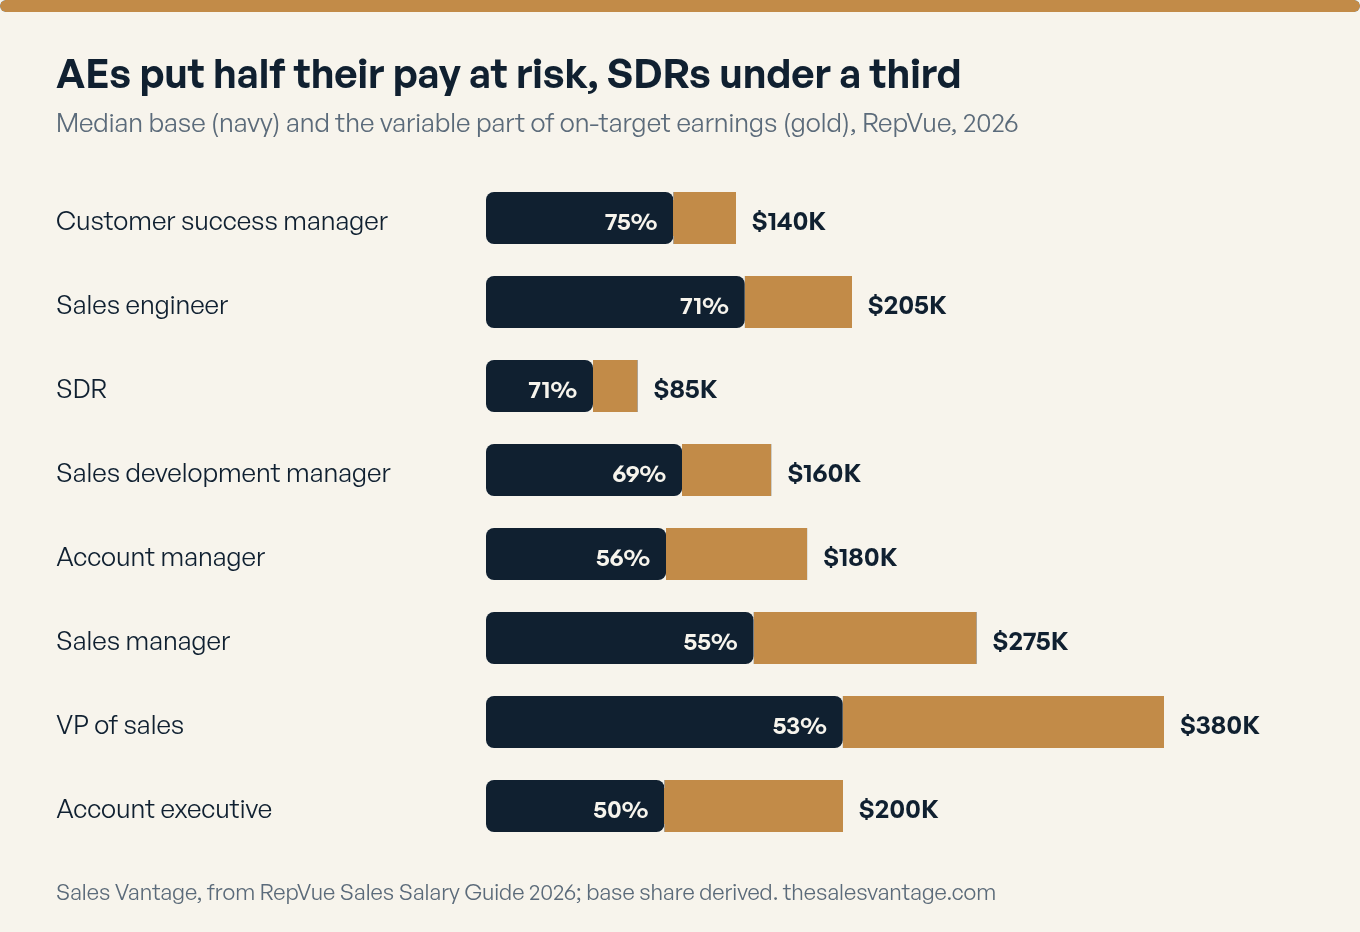
Account executives and account managers carry the most pay at risk among the individual contributor roles (base is 50% and 56% of OTE). SDRs, sales engineers and customer success managers sit between 71% and 75% base. Sales managers sit at 55%, and VPs of sales at 53%, so the people who set quota carry as much variable pay as the people who carry it.
Account executive segments: RepVue, 2026
| Account executive segment | Median base | Median OTE | Top performer | Hitting quota |
|---|---|---|---|---|
| SMB Account Executive | $70,000 | $135,000 | $280,947 | 42% |
| Mid Market Account Executive | $95,000 | $180,000 | $416,618 | 40% |
| Enterprise Account Executive | $140,000 | $275,000 | $671,111 | 38% |
| Strategic Account Executive | $150,000 | $300,000 | $801,453 | 42% |
| Key Account Executive | $160,000 | $310,000 | $784,207 | 40% |
| Federal Account Executive | $150,000 | $275,000 | $623,451 | 46% |
| SLED Account Executive | $110,000 | $210,000 | $566,386 | 45% |
Source: RepVue 2026. Self-reported by RepVue users; sector split not published.
Account executive live page: RepVue, October 2026
| Metric | Finding | Context | Data year |
|---|---|---|---|
| Account Executive, median base salary | $105,000 | Up 5% in the last year | 2026 |
| Account Executive, median on-target earnings | $200,000 | Up in the last year | 2026 |
| Account Executive, top-performer earning potential | $508,052 | Up 10% in the last year | 2026 |
| Account Executive, share attaining quota | 41.5% | Trailing 12 months ranged from 40.6% (July 2026) to 42.9% (February 2026) | 2026 |
| Account Executive salary submissions on the page | 35,512 | Verified submissions | 2026 |
Source: RepVue 2026. Read from the live Account Executive page on 18 October 2026; the page updates continuously, so these numbers will move.
SDRs: Bridge Group, 2025
| Metric | Finding | Context | Data year |
|---|---|---|---|
| Median SDR on-target earnings (OTE) | $80K | Unchanged since 2022; 0.56% CAGR over the decade, below inflation | 2025 |
| SDR base-to-variable split | 68:32 | $55K base and $25K variable at the median | 2025 |
| Share of SDRs at quota | 60% | Lowest reported in the study’s history | 2025 |
| Pipeline sourced per SDR | $3.78M | Up from $2.83M in 2022; raw pipeline, not closed-won | 2025 |
| Middle half of SDRs: pipeline per year | $1.9M to $6.4M | Range for 50% of respondents | 2025 |
| Average SDR ramp time | 3.0 months | Lowest since 2010; peak was 3.8 months in 2014 | 2025 |
| Average SDR tenure | 1.9 years | Highest since the early 2010s; 58% of companies report 12 to 23 months | 2025 |
| Median annual SDR attrition (2024) | 40% | 25th to 75th percentile: 21% to 57% | 2025 |
| Attrition split: involuntary / voluntary / promotions | 13% / 11% / 16% | Promotions were 34% in 2020 and have halved since | 2025 |
| Promotions as a share of SDR attrition in 2020 | 34% | Post-COVID peak | Older data 2020 |
| Median SDR-to-AE ratio | 1 SDR to 2.4 AEs | Most common model is 1 to 2 (31%) | 2025 |
| SDR manager median OTE | $146K | Up from $127K in 2018 | 2025 |
| Sales development director median OTE | $189K | Down from $193K in 2022, the first negative growth on record | 2025 |
| Sales development VP median OTE | $240K | Down from $243K | 2025 |
Source: Bridge Group SDR 2025. Sample: 351 B2B companies, 78% North America, 83% B2B SaaS. Treat it as a SaaS benchmark.
SDR pay has barely moved. Median OTE is $80,000, unchanged since 2022 and up just 0.56% a year, nominally, over the decade, according to Bridge Group. Pipeline sourced per SDR did rise, from $2.83M in 2022 to $3.78M, which Bridge Group puts down to bigger average deal sizes rather than more meetings.
What to do with it: If an SDR or BDR candidate has a $90,000 OTE offer from a SaaS company, check the base. The Bridge Group median is $55,000 base and $25,000 variable. A 50/50 split at the same OTE is a very different job.
Quota reality: fewer than half of AEs hit it, and 35% of reps expect to
The short version: OTE assumes 100%. Almost no data set says the typical rep gets there, and most companies plan for a large share of the team to miss.
Three sources, three different measures. Bridge Group asks company leaders what share of reps reached quota. Xactly asks what share of reps a company plans to see reach it. Salesforce asks reps what share of quota they expect to meet this year. Don’t rank them against each other. They still point the same way.
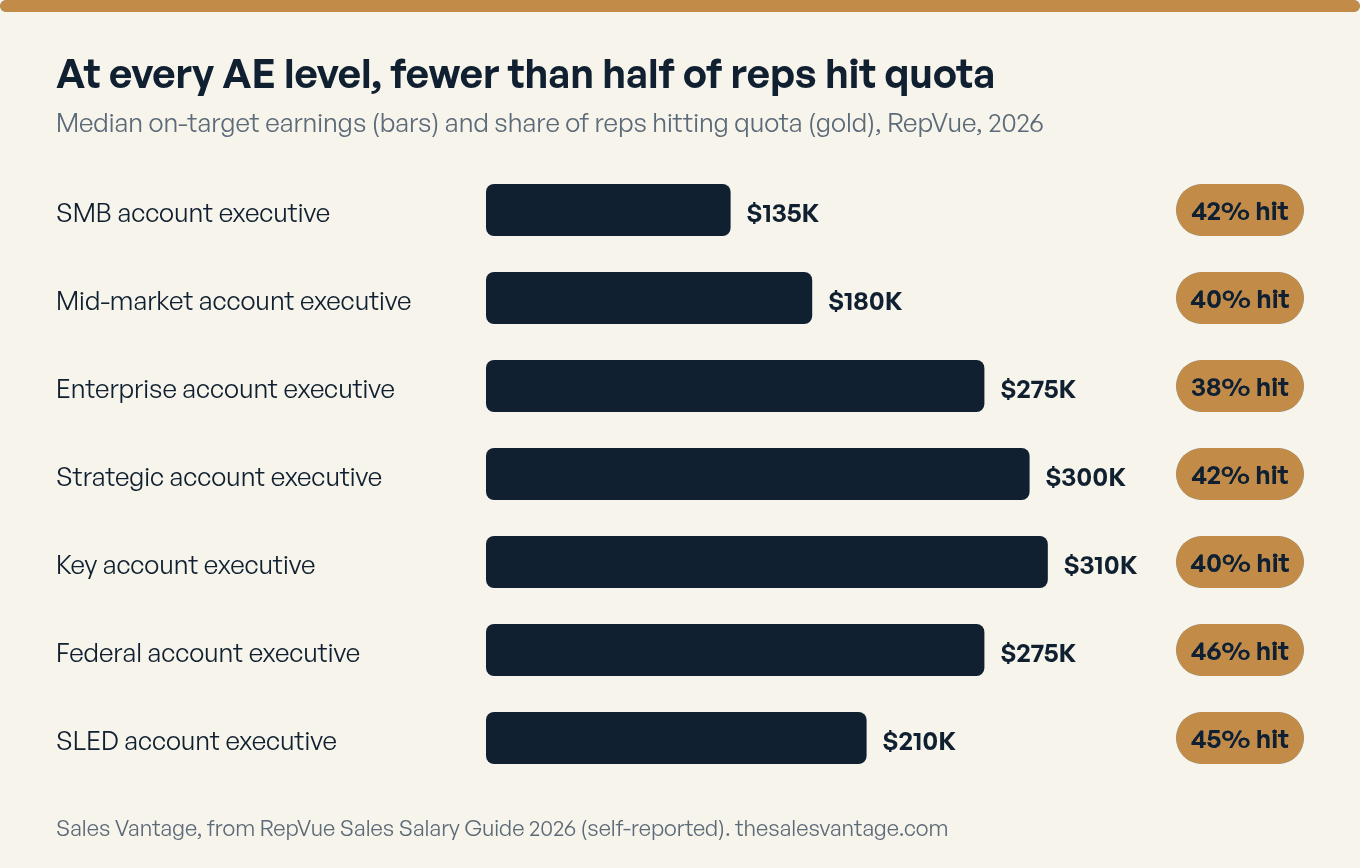
The offer letter says OTE. The job is the quota. RepVue’s AE segments show how those two interact. Median OTE runs from $135K for SMB to $310K for key accounts, yet the share hitting quota stays between 38% and 46% across every segment. Enterprise AEs, at $275K OTE, are the lowest at 38%. Higher OTE doesn’t buy an easier quota.
What reps expect to hit: Salesforce
| Share of quota the rep expects to meet this year | Reps, 2025 survey | Reps, 2024 survey |
|---|---|---|
| 25% or less | 2% | 4% |
| 26% to 50% | 12% | 26% |
| 51% to 75% | 25% | 27% |
| 76% to 99% | 24% | 27% |
| 100% | 18% | 10% |
| 101% to 125% or more | 17% | 6% |
Source: Salesforce 2026. 4,050 sales professionals in 22 countries, third-party panel, Salesforce is a CRM vendor. The 2024 column is the earlier survey as shown in the 2026 edition. The “100% or more” totals are derived by adding the two top rows.
The mood has improved. In the 2025 survey 35% of reps expect to meet 100% or more of quota, up from 16% a year earlier. But 39% expect to land at 75% or less, and expectations are not results.
What companies plan for: Xactly
| Metric | Finding | Context | Data year |
|---|---|---|---|
| Companies that plan for over 90% of AEs to reach quota | 9% | 2023 | |
| Companies planning for fewer than 70% of AEs to reach quota | 44% | 2023 | |
| Companies with a new-hire ramp period of six months or less | 77% | 2023 | |
| Companies expecting 10% or more of new AE hires not to last through ramp | 47% | 2023 | |
| Companies that do not know whether new AEs will last through ramp | 26% | Suggests it is not tracked | 2023 |
| Companies planning for AE attrition between 10% and 40% | 63% | 2023 | |
| Top revenue-growth challenge: competition | 71% | Respondents pick their top three | 2023 |
| Top revenue-growth challenge: market changes | 65% | 2023 | |
| Top revenue-growth challenge: pipeline development | 50% | 2023 |
Source: Xactly 2024. 230 B2B companies, 44% B2B technology; data from 2023.
The plan itself assumes misses. Only 9% of companies plan for more than 90% of AEs to reach quota. 44% plan for fewer than 70%. In the same survey, 47% of companies expect at least 10% of new AE hires not to survive ramp, and 26% don’t know. That last number is the one to remember. A quarter of companies can’t tell you how many of their new reps will last.
What to do with it: When a company quotes you OTE, ask for the attainment distribution for the last four quarters: how many reps made 100%, how many made 70%, and how many left. It’s the most useful question in an offer conversation, and a surprising number of hiring managers can’t answer it.
Pay mix and plan design: 50/50 for AEs, 65/35 for SDRs
The short version: most AE plans split pay evenly between base and variable. The quota that pays out the variable half is built mostly from new-logo revenue, with expansion in second place.
| Metric | Finding | Context | Data year |
|---|---|---|---|
| AE on-target earnings split, median | 50% base / 50% variable | Respondents: 230 companies | 2023 |
| Companies where AE OTE is above $150,000 | Almost half | Stated in the text; the report gives the chart but no exact figure in prose | 2023 |
| SDR split, median | 65% base / 35% variable | Higher base share than AEs | 2023 |
| Companies with a sales development function | 81% | More common at $25K+ annual contract value | 2023 |
| Sales development teams with a target OTE of $50,000 to $100,000 | 50% | 2023 | |
| Sales development teams with a target OTE over $100,000 | 35% | 2023 | |
| AE quota mix: new versus existing customer revenue, median | 50% / 50% | Expansion share grows with company size and contract value | 2023 |
| Companies with a quota element for new revenue | 89% | 2023 | |
| Companies with a quota element for customer expansion | 68% | 2023 | |
| Companies with a quota element for retention rates | 34% | 2023 | |
| Companies with a pipeline element in the AE plan | 16% | Although 50% name pipeline development a top-three growth challenge | 2023 |
| SMB companies where AE quota is above $500,000 | 31% | 2023 | |
| Mid-market companies where AE quota is above $750,000 | 37% | 2023 | |
| Enterprise companies where AE quota is above $2M | 33% | 2023 |
Source: Xactly 2024. 230 B2B companies, 44% B2B technology; data from 2023 for the 2024 plan year.
Almost all companies (89%) put a new-revenue element in the AE plan. Two thirds (68%) also put a quota on expansion, and only 34% tie any pay to retention. Pipeline development shows up as a plan element in just 16% of companies, even though 50% of them call it a top-three growth challenge. Pay follows revenue, not the work that creates it.
How plans are changed: Alexander Group, 2024 plan year
| Metric | Finding | Context | Data year |
|---|---|---|---|
| Total sales compensation cost change expected for 2024 | 5.3% | Versus 3.8% in 2023 | 2024 |
| Total sales compensation cost change in 2023 | 3.8% | 2023 | |
| Companies expecting to grow headcount in 2024 | 61% | Highest rate since 2019 | 2024 |
| Companies expecting to cut headcount in 2024 | 12% | Down from 29% in 2023 | 2024 |
| Sales employee turnover expected for 2024 | 9% | Down from a 14% peak in 2022 | 2024 |
| Companies making plan changes for 2024 | 91% | Up from 83% in 2023 | 2024 |
| Companies rating their 2023 plans very effective | 21% | 79% said plans could be more effective | 2023 |
| Companies driving more pay for performance in 2024 plans | 66% | 2024 | |
| Plan change reason: profitability focus | 49% | Number one reason | 2024 |
| Plan change reason: sales strategy shift | 40% | 2024 | |
| Plan change reason: new product or solution | 31% | 2024 | |
| Plan element being changed: measure weights | 43% | 2024 | |
| Plan element being changed: measures | 36% | 2024 | |
| Plan element being changed: ramps and accelerators | 36% | 2024 | |
| Plan element being changed: pay mix | 32% | 2024 | |
| Plan element being changed: pay levels | 24% | 2024 | |
| Plan design challenge: setting stretch but achievable goals | 47% | Tied with driving higher productivity (47%) | 2024 |
| Companies changing which jobs are eligible for a sales comp plan | 38% | 2024 | |
| Companies providing equity to core sellers | 58% | Average equity value $34K | 2024 |
Source: Alexander Group 2024. 300+ companies across nine industries, including manufacturing, life sciences and technology; the fieldwork is for the 2024 plan year, so treat it as a year or two old.
Location, hybrid work and communicating the plan
| Metric | Finding | Context | Data year |
|---|---|---|---|
| Companies that allow a hybrid workplace | 98% | 2024 | |
| Companies that vary pay by cost-of-labour location | 73% | 28% formal location rates, 28% a national range, 11% informal | 2024 |
| Companies that adjust pay when a seller relocates | 56% | 2024 | |
| Pay mix communicated as a percentage of target total compensation | 48% | 26% as a fixed target incentive, 21% as a percentage of base | 2024 |
| Plans communicated in month 1 of the fiscal year | 44% | 11% communicate two or more months ahead; 19% one month ahead | 2024 |
Source: Alexander Group 2024
What to do with it: Plan changes are the rule, not the exception. 91% of Alexander Group respondents changed something for 2024, and only 21% called their prior plans very effective. If a candidate’s current plan changed mid-year, that is normal. Ask what the new one pays, and ask when they were told.
Pay growth: sales roles cooled to 2.0% while all workers held near 3.3%
The short version: pay growth for sales roles dropped from 3.9% to 2.0% in a year. Everyone else’s barely moved.
The Employment Cost Index follows the same jobs over time, so it is a cleaner growth measure than setting one year’s median wage next to the next year’s. Here are the 12-month changes in total compensation.
| Private industry workers | 12 months to June 2025 | 12 months to March 2026 | 12 months to June 2026 |
|---|---|---|---|
| All private industry workers | 3.5% | 3.4% | 3.3% |
| Sales and related occupations | 3.9% | 3.0% | 2.0% |
| Sales and related, excluding incentive-paid occupations | 3.1% | 2.6% | 2.7% |
| Sales and office occupations | 3.7% | 3.3% | 2.8% |
| Management, professional and related | 3.4% | 3.4% | 3.5% |
Source: BLS ECI. Table 5, private industry workers, 12-month percent change in total compensation.
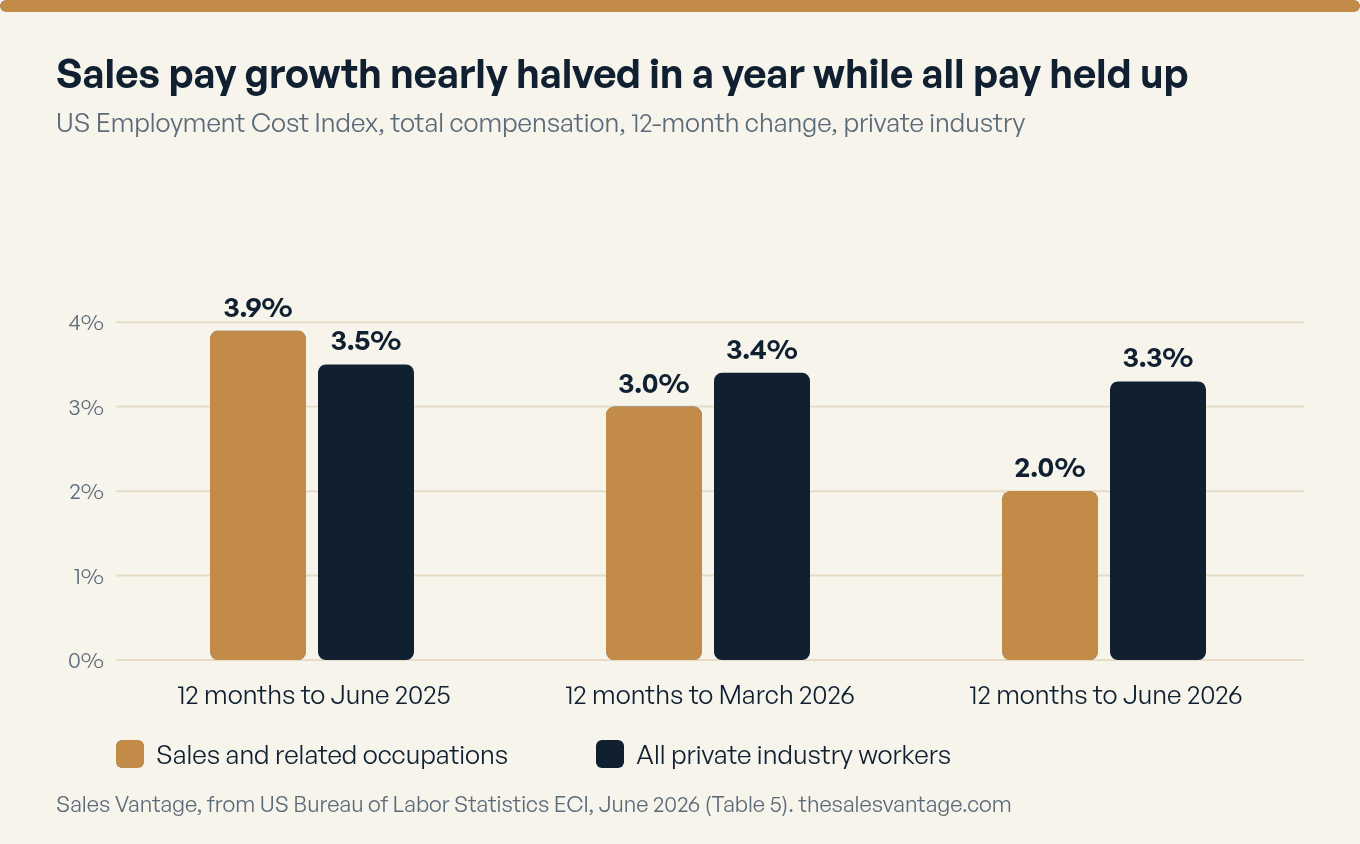
The gap is 1.3 points, and sales is now the slow lane. One more detail is worth a look. “Sales and related” excluding incentive-paid occupations rose 2.7% over the same 12 months, against 2.0% for the whole group. That suggests the slowdown sits in the commission-driven part of sales pay rather than in base salaries. It is an inference from two published lines, not something BLS says.
What an hour of sales labour costs
| June 2026, private industry | Total compensation per hour | Wages and salaries (share of total) | Benefits (share of total) | Supplemental pay (share of total) |
|---|---|---|---|---|
| Sales and related occupations | $35.85 | $26.99 (75.3%) | $8.86 (24.7%) | $1.05 (2.9%) |
| All private industry workers | $46.89 | $32.82 (70.0%) | $14.07 (30.0%) | $1.88 (4.0%) |
| Management, professional and related | $78.88 | $54.06 (68.5%) | $24.82 (31.5%) | $3.59 (4.6%) |
Source: BLS ECEC. Table 4, June 2026, private industry. Percentages are the share of total compensation.
An hour of sales labour costs employers $35.85 in total compensation, against $46.89 for private industry as a whole and $78.88 for management, professional and related occupations. Wages and salaries are 75.3% of the bill for sales and 70.0% for everyone. The flip side is a thinner benefits share (24.7% against 30.0%).
Raise budgets: WorldatWork
| Metric | Finding | Context | Data year |
|---|---|---|---|
| US mean total salary increase budget, 2026 actual | 3.6% | Matches the 3.6% employers projected a year earlier | 2026 |
| US mean total salary increase budget, 2027 projected | 3.6% | Fourth consecutive year without a higher annual projection, per WorldatWork | 2027 |
| US median total salary increase budget, 2026 actual and 2027 projected | 3.5% and 3.5% | All US employee categories shown | 2026 |
| US mean 2025 actual salary increase budget | 3.7% | From the 2025-2026 edition; projected 3.6% for 2026 | 2025 |
Source: WorldatWork SBS. All employee types, sales included but not separated. Used here as a yardstick for base-salary increases.
What changed in 2026 so far: RepVue
| Metric | Finding | Context | Data year |
|---|---|---|---|
| Sales Development Manager: share hitting quota, change January to July 2026 | -12.2 pts | The largest quota drop of the ten roles shown | 2026 |
| Strategic Account Executive: top-performer earnings, change January to July 2026 | +13.6% | Median base and OTE did not change | 2026 |
| Enterprise Account Executive: median OTE, change January to July 2026 | +3.8% | Share hitting quota fell 2.9 points | 2026 |
| Mid Market Account Executive: median base, change January to July 2026 | +5.6% | Median OTE rose 2.9% | 2026 |
| Customer Success Manager: median OTE, change January to July 2026 | +7.7% | The largest OTE rise of the ten roles shown | 2026 |
| Roles where the share hitting quota fell, January to July 2026 | 8 of 10 | Sales Engineer (+0.3 pts) and Sales Manager (+2.1 pts) were the two exceptions Derived by Sales Vantage. | 2026 |
Source: RepVue 2026. Mid-year update to the Sales Salary Guide, January to July 2026, self-reported.
What to do with it: Base pay is moving in small steps: a 3.6% budget, a 2.0% sales ECI. On a $100,000 base, 3.6% is $3,600 a year. None of these sources measure the pay jump when a rep changes employers, so don’t assume one. Ask the candidate what they need and test it against the medians above.
Sales leaders: executive OTE fell to $275,000 while IC OTE rose to $165,000
The short version: Pavilion’s member data shows executive pay falling and individual contributor pay rising. It’s a small, self-reported, tech-leaning sample, so take it as a direction, not a market rate.
| Metric | Finding | Context | Data year |
|---|---|---|---|
| Sales executives (Head of, VP, C-level): median annual base | $200,000 | Executive pay by function table | 2025 |
| Sales executives: median annual OTE | $350,000 | Highest of the six functions listed | 2025 |
| All GTM executives: median annual OTE, 2024 | $315,000 | Down 12.7% to 2025 | 2024 |
| All GTM executives: median annual OTE, 2025 | $275,000 | 2025 | |
| Executives with equity or stock options, 2025 | 77% | 85% in 2023, 82% in 2024 | 2025 |
| Executives who received a signing bonus, 2025 | 10% | 14% in 2024 | 2025 |
| Executives with pre-negotiated severance, 2025 | 27% | 34% in 2024 | 2025 |
| Individual contributors: median OTE, 2025 | $165,000 | Up 23% from $134,000 in 2024 | 2025 |
| Managers: median OTE, 2025 | $145,500 | Up 2% from $143,000 | 2025 |
| Directors: median OTE, 2025 | $200,000 | Down 5% from $209,500 | 2025 |
| Non-executives who received options or equity, 2025 | 53% | 68% in 2024 | 2025 |
| Respondents whose company missed its 2024 revenue goal | 46% | 23% hit target, 31% beat it | 2024 |
Source: Pavilion 2025. B2B tech go-to-market roles; sample size not stated in the PDF; self-reported.
Median OTE for all go-to-market executives fell 12.7% in a year, from $315,000 to $275,000. Individual contributors went the other way, up 23% from $134,000 to $165,000. Directors dipped 5%. Sales executives still lead the six functions Pavilion lists at $350,000, and 77% of executives hold equity or options (85% in 2023).
What to do with it: Be careful with that 23%. It is one survey year from one membership base, and Bridge Group’s AE median moved a much smaller amount over a longer stretch, from $190K in 2024 to $200K in 2026. Use Pavilion as a signal, not a salary band.
Pay transparency: half of US postings now show a range, up from one in seven
The short version: a candidate can now find a pay range in about half or more of job posts in the US, UK and Canada. Sales postings sit at the same level as the market overall.
| Share of Indeed postings with a pay range | US | UK | Canada | US Sales sector postings |
|---|---|---|---|---|
| Older data January 2020 | 13.6% | 40.1% | 18.1% | 13.4% |
| Older data January 2022 | 23.3% | 55.2% | 28.0% | 24.3% |
| January 2024 | 41.7% | 64.2% | 41.6% | 40.9% |
| January 2026 | 49.5% | 55.8% | 51.5% | 50.9% |
| August 2026 | 51.8% | 59.5% | 57.6% | 50.9% |
Source: Indeed Hiring Lab. Share of Indeed postings with explicit pay information. UK, US and Canada series are monthly; the sector series is US only. The rank is derived from the August 2026 sector table.
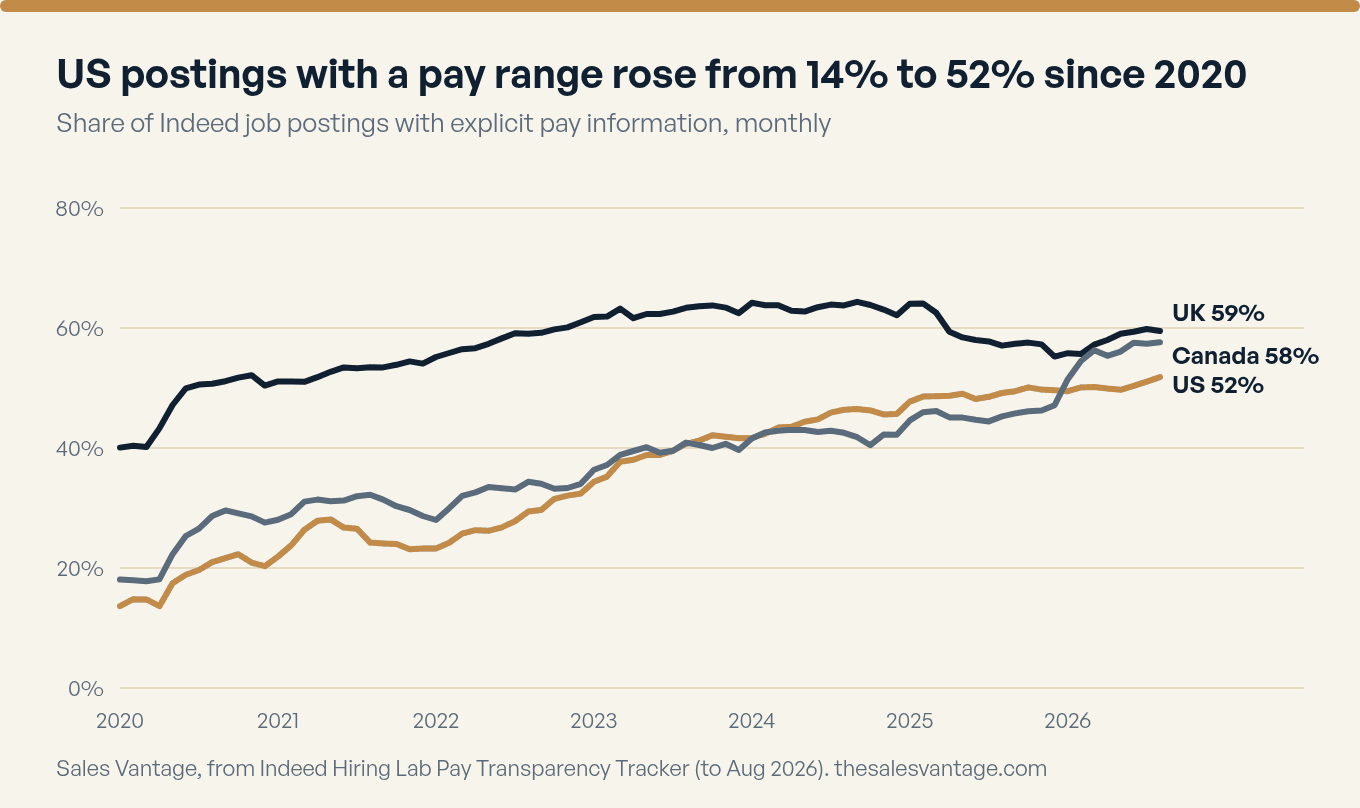
The US rose by 38 percentage points between January 2020 and August 2026. The UK started higher, at 40.1%. It was 64.2% in January 2024 and is 59.5% in August 2026. Sales sits at 50.9%, ranked 23rd of 47 US sectors, so it is mid-table.
What reps say about transparency: Salesforce
| Metric | Finding | Context | Data year |
|---|---|---|---|
| Reps who wish there were more transparency in how their compensation is calculated | 76% | 2025 | |
| Reps who are aware of opportunities to increase their pay | 76% | 2025 | |
| Reps who know the commission amount for every deal they work | 73% | 2025 | |
| Sales leaders who say their tech stack lacks compensation management capabilities | 32% | Reported for sales leaders | 2025 |
| Top reason to change jobs, Gen Z | Lack of advancement | Then overly complex sales cycles, then low pay | 2025 |
Source: Salesforce 2026. 4,050 sales professionals in 22 countries; Salesforce is a CRM vendor.
What to do with it: With about half of postings now showing a range, one that says only “competitive” stands out for the wrong reason. If you can’t publish a range because it would expose gaps between current reps and new hires, fix that before the posting goes live.
Why reps leave: advancement comes first for three of four generations
The short version: lack of advancement is the top reason for Gen Z, Millennials and Baby Boomers. Pay comes first only for Gen X. Across industries, retail churns most and finance least.
| Metric | Finding | Context | Data year |
|---|---|---|---|
| Top reason to change jobs, Millennials | Lack of advancement | Then not enough flexibility, then low pay | 2025 |
| Top reason to change jobs, Gen X | Low pay | Then lack of advancement, then lack of direction | 2025 |
| Top reason to change jobs, Baby Boomers | Lack of advancement | Then low pay, then lack of direction | 2025 |
Source: Salesforce 2026. Top-three job-change reasons by generation, 2025 survey.
Quits rate by industry: JOLTS
| Industry | Quits rate, August 2026 (monthly, % of employment) |
|---|---|
| Total private | 2.1% |
| Manufacturing | 1.6% |
| Wholesale trade | 1.3% |
| Professional and business services | 2.1% |
| Information | 1.1% |
| Finance and insurance | 1.0% |
| Retail trade | 3.0% |
Source: BLS JOLTS. Quits as a percentage of employment, month of August 2026, seasonally adjusted, preliminary.
Wholesale trade quits at 1.3% a month and manufacturing at 1.6%. Finance and insurance is lowest at 1.0%, and retail trade is three times that at 3.0%. For the churn inside sales teams specifically, see the SDR numbers above: median attrition of 40% in 2024, of which only 11 points were voluntary quits.
What to do with it: If a rep tells you they’re leaving for pay, ask what they’re leaving for. In three of the four generations in the Salesforce data, advancement comes first. Match the pay, and then show them the next role.
UK and Canada: where the numbers come from and how to read them
The short version: the UK publishes pay and incentive pay by job; Canada publishes hourly wages by job and region. Neither lets you compare directly with US OTE.
United Kingdom: ONS ASHE, 2025 provisional
| UK full-time employee jobs, 2025 | Median gross annual pay | Change on 2024 | 25th percentile | 75th percentile | Median incentive pay in the year |
|---|---|---|---|---|---|
| Marketing, sales and advertising directors (1132) | £94,135 | 7.8% | £65,527 | £134,962 | £19,691 |
| Sales accounts and business development managers (3556) | £57,625 | 4.4% | £43,049 | £79,598 | £8,019 |
| Business sales executives (3552) | £37,924 | 3.2% | £30,244 | £52,105 | £6,244 |
| Sales, marketing and related associate professionals (group) (355) | £45,000 | 5.3% | £32,895 | £64,684 | £5,798 |
| Sales and customer service occupations (major group 7) (7) | £26,959 | 5.9% | £23,517 | £32,551 | £1,184 |
| Sales occupations (group 71) (71) | £26,121 | 6.6% | £22,760 | £31,456 | £803 |
| Sales and retail assistants (7111) | £25,056 | 5.5% | £21,970 | £29,846 | £600 |
| All employees | £39,039 | 4.3% | £29,262 | £54,009 | £2,389 |
Source: ONS ASHE. Full-time employee jobs held for a year or more, tax year to 5 April 2025, provisional. ONS has said a revised 2025 dataset is due in October or November 2026, so these figures may change. It suppresses estimates with high sampling variability.
Business sales executives earn a median £37,924, roughly the UK all-employee median of £39,039, and a median £6,244 of incentive pay on top, 16% of gross pay. Sales accounts and business development managers earn £57,625 and £8,019 in incentive pay. Median pay for those two management groups grew 4.4% and 7.8% on 2024.
Canada: Job Bank wage reports
| Occupation (NOC 2021), Canada | Low ($/hour) | Median ($/hour) | High ($/hour) |
|---|---|---|---|
| Technical sales specialists, wholesale trade (62100) | $20.00 | $37.07 | $66.11 |
| Corporate sales managers (60010) | $36.54 | $60.10 | $112.00 |
| Sales and account representatives, wholesale trade (non-technical) (64101) | $19.23 | $31.50 | $56.23 |
Source: Job Bank. Hourly wages from the Labour Force Survey, 2023-2024; low and high are the lower and upper ends Job Bank reports.
| Technical sales specialists, wholesale trade (NOC 62100) | Median ($/hour) |
|---|---|
| Ontario | $38.00 |
| Alberta | $38.46 |
| British Columbia | $42.79 |
| Quebec | $33.65 |
| Saskatchewan | $33.89 |
| Manitoba | $32.69 |
| Nova Scotia | $28.85 |
| Prince Edward Island | $27.88 |
| New Brunswick | $27.00 |
| Newfoundland and Labrador | $25.00 |
| Toronto Region | $40.06 |
| Lower Mainland-Southwest (Vancouver area) | $41.03 |
| Edmonton Region | $38.46 |
| Calgary Region | $36.85 |
| Winnipeg Region | $35.10 |
| Montreal Region | $34.62 |
Source: Job Bank. Annualised medians (derived at 2,080 paid hours): $77,106 for technical sales specialists and $125,008 for corporate sales managers.
What to do with it: Canadian wages here are hourly and cover 2023 to 2024, so they are older than the US and UK data. Use them for relative position by province (British Columbia’s $42.79 against Newfoundland’s $25.00), not as a current offer benchmark.
Job outlook: no growth for most B2B reps, but 123,400 openings a year
The short version: BLS projects no net growth for wholesale and manufacturing reps. The jobs still open up constantly, because people leave.
| Occupation | Jobs, 2025 | Projected change, 2025-35 | Openings a year |
|---|---|---|---|
| Sales managers | 650,100 | 4% | 47,300 |
| Sales engineers | 51,600 | 3% | 3,800 |
| Wholesale and manufacturing sales reps | 1,571,400 | 0% | 123,400 |
| Securities, commodities and financial services sales agents | 531,000 | 1% | 35,100 |
| Insurance sales agents | 572,600 | 3% | 43,100 |
| Real estate brokers and sales agents | 530,600 | 2% | 40,400 |
| Advertising sales agents | 99,300 | -7% | 7,800 |
| Retail sales workers | 4,271,400 | 0% | 550,600 |
Source: BLS Handbook. Handbook pages modified through 27 August 2026; 2025 base year, projections to 2035. The Handbook’s jobs figures differ from OEWS counts because they are projection base-year estimates.
Sales managers add the most jobs (+4%, 47,300 openings a year). Sales engineers grow 3% on a small base of 51,600. Advertising sales agents shrink 7%. For wholesale and manufacturing reps, zero growth still means 123,400 openings a year, almost all from people moving on. That is the hiring market in one number, and it is why the companion hiring piece treats most sales hiring as replacement hiring.
Offer Check: a Sales Vantage framework for reading a sales offer
Framework, not a statistic The numbers above are other people’s data. The checklist below is ours. It turns them into questions you can ask before accepting, or making, a sales offer. The worked example is illustrative and uses made-up round numbers, not a benchmark.
| Check | The question | Benchmark in this article |
|---|---|---|
| 1. Same unit | Is the figure base, OTE or last year’s W-2? Compare like with like. | OEWS is actual pay; surveys are OTE |
| 2. Base share | What share of OTE is guaranteed? | AEs about 50%, SDRs about 65 to 71% |
| 3. Quota load | Quota divided by OTE. Is it near the market? | 4.6x for B2B AEs (Bridge Group 2026) |
| 4. Attainment | How many reps hit it, and how many reps were there? | 48% of AEs, 60% of SDRs |
| 5. Ramp cover | Is there a guaranteed draw for the whole ramp? | AE ramp 6.2 months, SDR 3.0 months |
| 6. Market base | Does the base match the role, industry and state? | OEWS and RepVue tables above |
| 7. Range posted | Did the company publish a range, and does the offer match? | 52% of US postings show one |
Here is the arithmetic for check 3 and 4 on an invented offer: $100,000 base, $100,000 variable, $900,000 quota. Quota over OTE is 4.5x, close to the 4.6x market figure. Now apply an attainment guess. If the typical rep lands at 80% of quota and the plan pays linearly, expected earnings are about $100,000 + 0.8 x $100,000 = $180,000. That is the number to compare with a flat-salary alternative, not $200,000. Real plans have accelerators, caps and thresholds, so ask for the plan document and recompute.
One more rule. Never use the “share of reps at quota” as an average attainment in this calculation. 48% of reps at quota tells you nothing about how far the other 52% fell short. Ask for the distribution instead.
Methodology and sources ledger
Every statistic on this page was read from the publisher’s own page, PDF, data file or API response in October 2026 and rechecked against our saved evidence on 19 October 2026. We used no figure from a secondary site, and no number is carried over from another article without being checked at its source. Each stat has a row in the verification sheet (source URL, page or table, sample, date and definition). BLS OEWS and JOLTS values were retrieved with the BLS Public Data API, and the series IDs are in that sheet so anyone can reproduce them. The other sources were read from the publisher’s web page or PDF.
Sales Vantage ran no survey and has no proprietary data in this article. Where we added, subtracted or ranked, the cell or text says so. Dates are the period the data describes, not the publication date.
| Source | Publication | Data year | Sample | Flag |
|---|---|---|---|---|
| BLS OEWS | US Bureau of Labor Statistics, Occupational Employment and Wage Statistics (OEWS), May 2025, national, industry and state estimates (read through the BLS Public Data API) | 2025 (May reference period) | Government establishment survey; employment and wage estimates by occupation, industry and state | National statistics |
| BLS Handbook | US Bureau of Labor Statistics, Occupational Outlook Handbook, sales and sales management occupation pages (modified 27 Aug 2026) | 2025 base year; projections 2025-35 | Government employment projections | National statistics |
| BLS ECI | US Bureau of Labor Statistics, Employment Cost Index, June 2026 (released 31 Jul 2026), Table 5 | 2026 (12 months to June) | Government employer survey | National statistics |
| BLS ECEC | US Bureau of Labor Statistics, Employer Costs for Employee Compensation, June 2026 (released 9 Sep 2026), Table 4 | 2026 (June) | Government employer survey | National statistics |
| BLS JOLTS | US Bureau of Labor Statistics, Job Openings and Labor Turnover Survey, quits rate, August 2026, seasonally adjusted (read through the BLS Public Data API) | 2026 (August, preliminary) | Government establishment survey | National statistics |
| ONS ASHE | Office for National Statistics, Annual Survey of Hours and Earnings (ASHE), 2025 provisional results, Tables 14.7a and 14.8a (occupation by four-digit SOC 2020) and the 2025 bulletin | 2025 (provisional; annual pay is for the tax year to 5 April 2025) | 1% sample of PAYE records; full-time employee jobs | National statistics |
| Job Bank | Government of Canada, Job Bank wage reports (Statistics Canada Labour Force Survey data, updated 19 Nov 2025) | 2023-2024 | Labour Force Survey wage data pooled over two years | National statistics |
| Bridge Group AE 2026 | The Bridge Group, AE Models, Motions & Metrics 2026 (10th edition, published 22 Jun 2026) | 2026 (fielded Q1-Q2 2026) | 158 B2B companies, answered by VP Sales, CRO, RevOps and CFO-level leaders | Industry survey |
| Bridge Group SDR 2025 | The Bridge Group, SDR Models, Motions & Metrics 2025 (10th edition, published 6 Feb 2025) | 2025 (fielded 2024-2025; attrition is for 2024) | 351 B2B companies; 78% North America; 83% B2B SaaS; median revenue $47M; median ASP $50K | SaaS-heavy sample |
| Alexander Group 2024 | The Alexander Group, 2024 Sales Compensation Trends Survey (January 2024) | 2023 actuals and 2024 plans (fielded for the 2024 plan year) | 300+ companies across nine industries including manufacturing, life sciences and technology | Multi-industry survey |
| Xactly 2024 | Xactly with Benchmarkit, 2024 Sales Compensation Report (full report PDF, November 2023) | 2023 (fielded for the 2024 plan year) | 230 companies; 44% B2B technology, 16% B2B services, 5% manufacturing; 36% over $1B revenue | Tech-heavy sample; vendor of compensation software |
| Salesforce 2026 | Salesforce, State of Sales, 7th edition (published 3 Feb 2026) | 2025 (fielded Aug-Sep 2025) | 4,050 sales professionals in 22 countries, third-party panel | Vendor survey |
| Pavilion 2025 | Pavilion with Captivate Talent, 2025 GTM Compensation Report (Q1 2025 survey data) | 2025 (survey data from Q1 2025, compared with 2024) | Member and partner survey of go-to-market professionals; sample size not stated in the PDF | Tech-heavy, self-reported |
| RepVue 2026 | RepVue, Sales Salary Guide: What Sales Reps are Earning in 2026 (published 2 Jan 2026, mid-year update July 2026) and live Account Executive salary page (data updated 18 Oct 2026) | 2026 | User-submitted compensation; the live Account Executive page cites 35,512 verified submissions | Self-reported, tech-leaning |
| WorldatWork SBS | WorldatWork, Salary Budget Survey 2026-2027, top-level results (published 15 Jul 2026) | 2026 actual; 2027 projected | 1,799 organizations, 4,733 submissions, survey closed May 2026 | All-employee benchmark |
| Indeed Hiring Lab | Indeed Hiring Lab, Pay Transparency Tracker (hiring-lab/pay-transparency on GitHub, data to August 2026) | 2020-2026 (monthly) | Share of Indeed job postings with explicit pay information; sector series for the US only | Job-posting data |
What we left out
- Figures that appear only in chart images we could not read reliably, in the Xactly, Alexander Group, Pavilion and Salesforce PDFs. We used only values stated in the text or confirmed on the rendered page.
- Any pay or quota number we could find only on a secondary site, for example a blog quoting a survey without linking it.
- BLS employment or wage cells that were suppressed (Maine, South Dakota and Utah for technical reps in some measures) and industry cells with fewer than 500 jobs.
- Equity and long-term-incentive values, because none of the sources publish them for sales roles in a comparable way.
- Pavilion’s sample size, which the PDF does not state. We kept its figures with a flag.
Found an error? Email contact@thesalesvantage.com with the number and the source and we will check it. To cite this page: Khantwal, H. (2026). Sales Compensation Statistics 2026. Sales Vantage. https://thesalesvantage.com/blog/sales-compensation-statistics/
Frequently asked questions
It depends heavily on what they sell. BLS reports a May 2025 median of $38,530 for all sales and related occupations, which includes millions of retail workers. Wholesale and manufacturing reps who sell non-technical products earn a median $72,080, those who sell technical and scientific products $104,920, sales engineers $124,900 and sales managers $148,270. The median for all US occupations is $50,980.
The Bridge Group’s 2026 study of 158 B2B companies puts median AE on-target earnings at $200,000, up from $190,000 in 2024. RepVue’s 2026 self-reported data also lists $200,000, ranging from $135,000 for SMB AEs to $310,000 for key account AEs. Xactly’s 2023 survey found a median 50/50 base to variable split. On-target earnings is what a plan pays at 100% of quota, not what the average rep earns.
The Bridge Group found 48% of AEs at quota in 2026 (51% in 2024) and 60% of SDRs in 2025, its lowest on record. RepVue’s live AE page shows 41.5% attaining quota in 2026. These measure different things, and none of them is average attainment. Xactly found 44% of companies plan for fewer than 70% of AEs to reach quota.
For account executives, Xactly’s 2023 survey reports a median 50% base and 50% variable. For SDRs it reports 65% base and 35% variable, and The Bridge Group reports 68:32 ($55,000 base and $25,000 variable) for a median OTE of $80,000. RepVue’s medians imply base shares of 50% for AEs, 71% for SDRs and 55% for sales managers (derived).
Slower than other pay. The BLS Employment Cost Index has total compensation for sales and related occupations up 2.0% in the 12 months to June 2026. All private-industry workers got 3.3%. A year earlier, sales was at 3.9%. WorldatWork reports employers budgeted a 3.6% average salary increase for 2026 and project 3.6% for 2027, across all employee types.
The ONS Annual Survey of Hours and Earnings (2025 provisional) shows a median £37,924 for business sales executives, with £6,244 median incentive pay, and £57,625 for sales accounts and business development managers. In Canada, Job Bank reports median hourly wages of $37.07 for technical sales specialists in wholesale trade and $60.10 for corporate sales managers (2023 to 2024), about $77,106 and $125,008 a year at 2,080 hours.
Hiring a salesperson?
Sales Vantage recruits salespeople and sales leaders across most industries in the US, UK and Canada, with manufacturing and medical devices as our lead specialty. You pay only if you hire, and every placement carries a 90-day replacement guarantee on the terms in our client agreement. Browse more research on the Sales Vantage blog.