By Himanshu Khantwal · Published October 16, 2026 · Last updated October 19, 2026 · 110 statistics from 24 sources · What changed
The short answer: US sales hiring is mostly replacement hiring. BLS projects no growth in wholesale and manufacturing sales rep jobs to 2035, yet about 123,400 openings a year. Filling a typical non-executive role takes a median 39 days (SHRM, all functions), and in sales a hire takes nearly three months to reach a first call (SalesFuel). Once hired, 48% of account executives hit quota (Bridge Group, 2026), a new AE takes about 6.2 months to ramp, and SalesFuel estimates a bad sales hire costs $177,171.
This page collects 110 numbers from 24 primary sources, each linked at the claim. It is a synthesis of other organisations’ research: Sales Vantage ran no survey, and no figure comes from our placements or clients. Much of the quota, ramp and attrition data comes from B2B companies, many of them software firms (83% of the Bridge Group SDR sample is SaaS), so read it as a benchmark for SaaS-style selling. The BLS, SHRM, Alexander Group and national statistics figures cover broader populations, and the headline table below shows the population for each.
Key takeaways
- 123,400 openings a year are projected for US wholesale and manufacturing sales reps, while employment is projected to change 0% (about -7,700 jobs, which rounds to zero) from 2025 to 2035. (BLS projection 2025-35)
- 39 days is the median time to fill a non-executive role, across all functions rather than sales only. (SHRM, 2026)
- Nearly 3 months is how long companies typically spend hiring a sales rep before that rep makes a first call. (SalesFuel, 2026)
- 48% of account executives hit annual quota, down from 51% in 2024. (Bridge Group, 2026, 158 B2B companies)
- 6.2 months is the average AE ramp to full productivity, the longest in the study’s history. (Bridge Group, 2026)
- $177,171 is the estimated average cost of a bad B2B sales hire in the US (an estimate, not a measured average). (SalesFuel, 2026)
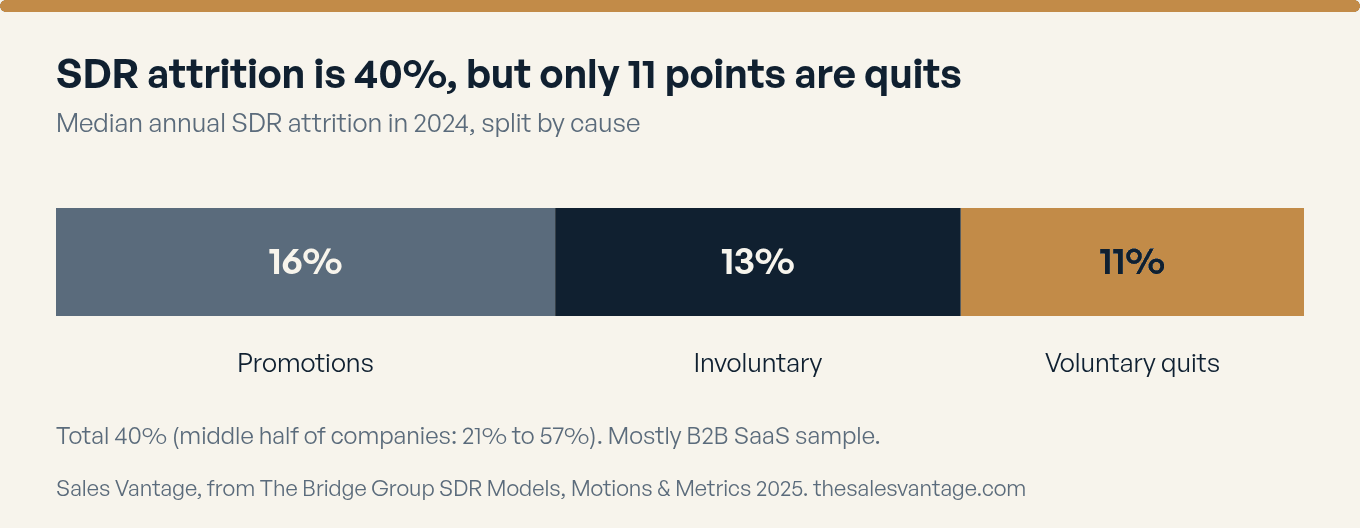
- 40% median annual SDR attrition, of which only 11 points are voluntary quits and 16 are promotions. (Bridge Group, 2024 data, 351 companies, 83% SaaS)
- $104,920 is the median wage for wholesale and manufacturing reps who sell technical and scientific products. (BLS, May 2025)
- -6.8% change in US sales and RevOps job postings in the 30 days to 5 September 2026, while all US postings rose 5.0% (one window, a snapshot). (PredictLeads, 2026)
How to read these numbers
- Quota has three different measures. The share of reps at quota (Bridge Group), average quota attainment, and the share a company plans to hit (Xactly) are separate metrics. Do not rank one against another.
- SDR attrition includes promotions. The Bridge Group’s 40% is 13 points dismissals, 11 points quits and 16 points promotions. Alexander Group’s turnover figures are a different measure, the average across all sales employees.
- Population changes the answer. The Bridge Group SDR sample is 83% SaaS and Xactly surveyed B2B technology and services firms. The Bridge Group AE, Salesforce and HubSpot pages do not break their samples out by sector. SHRM time and cost figures cover all roles. BLS covers the US only. The Canada and UK figures come from their national statistics offices.
- Dates. The year beside each source is the year the data describes or was collected. Anything from 2022 or earlier carries an Older data tag.
Headline benchmarks at a glance
| Metric | Finding | Role or population | Data year | Source | Sample |
|---|---|---|---|---|---|
| Openings | 123,400 a year, with 0% employment change | US wholesale and manufacturing sales reps | Projection 2025-35 | BLS | Government projection |
| Time to fill | 39 days median | US non-executive roles, all functions | 2026 | SHRM | 4,600+ organisations |
| Time to first call | Nearly 3 months | Sales hires | 2026 | SalesFuel | Not stated |
| Cost per hire | $5,475 non-executive, $35,879 executive | US, all functions | 2025 | SHRM | 2,371 SHRM members responded (varies by metric) |
| AE quota attainment | 48% of AEs at quota (51% in 2024) | B2B companies | 2026 | Bridge Group | 158 companies |
| SDR quota attainment | 60% of SDRs at quota | B2B companies, 83% SaaS | 2025 | Bridge Group | 351 companies |
| AE ramp | 6.2 months average | B2B companies | 2026 | Bridge Group | 158 companies |
| SDR attrition | 40% median (13 / 11 / 16 split) | B2B companies, 83% SaaS | 2024 data | Bridge Group | 351 companies |
| Cost of a bad hire | $177,171 estimate | US B2B sales hires | 2026 | SalesFuel | Not stated |
| AE pay | $200K median on-target earnings | B2B companies | 2026 | Bridge Group | 158 companies |
| Technical rep pay | $104,920 median wage | US reps selling technical and scientific products | May 2025 | BLS | National wage survey |
| Passive candidates | 85% active or open (25% + 45% + 15%) | Employed professionals, 26 countries | 2014 Older data | 18,000 professionals |
What is in this page
- US sales hiring is mostly replacement hiring, not growth
- Most companies planned to hold or grow sales teams, and the latest postings data shows a dip
- The US, UK and Canadian job markets are flat, with manufacturing vacancies rising in Canada
- Filling a role takes a median 39 days, and a sales hire takes nearly three months to reach a first call
- Most employed professionals are open to a recruiter, but the best data on it is from 2014
- SalesFuel estimates a bad sales hire costs $177,171, and most managers still do not test sales skills
- Fewer than half of account executives hit quota
- A new AE takes six months to ramp, and the clock starts before day one
- SDR attrition is 40%, but only 11 points of it are reps quitting
- Sales pay runs well above the national median once the product gets technical
- Manufacturing employs a fifth of sales engineers and pays technical reps $106,650
- A hiring scorecard built from these benchmarks
- Related context beyond hiring
- Methodology and sources
- Update log
- Frequently asked questions
US sales hiring is mostly replacement hiring, not growth
Sales is a big occupation with flat headcount. Most openings come from people leaving, not from new seats.
- 1,571,400 wholesale and manufacturing sales representative jobs existed in the US in 2025, one of the largest B2B sales occupations in the country. BLS, 2025
- 0% projected change in those jobs from 2025 to 2035 (a drop of about 7,700 jobs, which rounds to zero). Headcount is flat, so most hiring is replacement hiring. BLS, 2025
- 123,400 openings a year are projected for these reps over the decade, almost all from people leaving the occupation or retiring rather than from new seats. BLS, 2025
- 292,000 of those reps sold technical and scientific products in 2025. That is the pool closest to industrial equipment and medical device selling. BLS, 2025
- 51,600 sales engineer jobs existed in the US in 2025. BLS, 2025
- 3% projected growth for sales engineers from 2025 to 2035, in line with the average for all occupations. BLS, 2025
- 3,800 sales engineer openings a year are projected, many from people moving to other occupations or retiring, according to BLS. BLS, 2025
- BLS counts 650,100 sales manager jobs in the US in 2025 and notes that sales managers recruit, hire and train new sales staff. BLS, 2025
- 4% projected growth for sales managers from 2025 to 2035, about 29,000 jobs. That is faster than the flat outlook for sales rep roles. BLS, 2025
- 47,300 sales manager openings a year are projected. BLS, 2025
What it means for hiring managers: Because headcount is flat, nearly every search is a replacement search, so you are bidding against other companies for the same experienced reps. Write the scorecard before you post the role, and be ready to move within days of a good first conversation.
Most companies planned to hold or grow sales teams, and the latest postings data shows a dip
Plans going into 2024 and 2025 were positive. PredictLeads’ postings data for one 30-day window in 2026 is more cautious, especially for senior roles.
- 61% of companies expected to increase sales headcount in 2024, the highest rate since 2019. Alexander Group, 2024
- 12% expected to decrease sales headcount, down from 29% a year earlier. Alexander Group, 2024
- Looking ahead to 2025, 45% of sales leaders expected their teams to grow. HubSpot, 2025
- 52% of sales leaders expected team size to hold steady. HubSpot, 2025
- 3% of sales leaders expected their teams to shrink. HubSpot, 2025
- 59.9% of sales teams were on track to meet or surpass their revenue targets, which leaves about four in ten behind (derived). HubSpot, 2025
- In PredictLeads’ crawl, US sales and RevOps job postings changed by -6.8% in the 30 days to 5 September 2026, to 58,319, while all US postings rose 5.0%. PredictLeads, 2026
- 2.62% is sales and RevOps’ share of all US job postings in that window, down from 2.96%. PredictLeads, 2026
- -8.3% change in account executive and field sales postings in the same window, steeper than the sales average. PredictLeads, 2026
- -4.0% change in solutions and sales engineering postings. PredictLeads, 2026
- -15.2% change in director-level sales postings, with head-of-function down 27.1%. PredictLeads, 2026
- -27.1% change in head-of-function sales and RevOps postings, the steepest fall of any level reported here. PredictLeads, 2026
- +5.9% change in junior and entry-level sales postings. Postings for junior reps rose while postings for leaders fell. PredictLeads, 2026
What it means for hiring managers: Treat the 2024 and 2025 plans as intent, not a count of open seats. The one PredictLeads window shows junior and sales engineering postings holding up better than AE and leadership postings, so check the live market for your exact role before you set a timeline.
The US, UK and Canadian job markets are flat, with manufacturing vacancies rising in Canada
Macro data does not show a tight market. There are 2.5 unemployed people per vacancy in the UK and 3.0 in Canada.
- US employers had 7.1 million job openings in August 2026 (a 4.3% rate). BLS JOLTS, 2026
- 5.2 million US hires in August 2026 (3.3% hires rate). BLS JOLTS, 2026
- 3.1 million US quits in August 2026 (a 1.9% rate). BLS JOLTS, 2026
- 510,200 job vacancies in Canada in Q2 2026, a 2.8% vacancy rate, unchanged from the previous quarter. Statistics Canada, 2026
- 3.0 unemployed people for every Canadian job vacancy in Q2 2026, down slightly from 3.1 a year earlier. Statistics Canada, 2026
- 25.9% of Canadian vacancies had been open 90 days or more in Q2 2026, down from a peak of 39.5% in Q4 2022. Statistics Canada says this suggests employers having fewer difficulties filling positions than a year earlier. Statistics Canada, 2026
- 153,000 vacancies in Canadian sales and service occupations in Q1 2026, up 8,400 (+5.8%) in a quarter and the first quarterly increase since Q4 2021. Statistics Canada, 2026
- +2.6% year-over-year change in Canadian sales and service vacancies in Q2 2026 (+4,000). Statistics Canada, 2026
- +19.2% year-over-year change in Canadian vacancies in manufacturing and utilities occupations in Q2 2026 (+3,200). Statistics Canada, 2026
- UK vacancies fell to 702,000 in June to August 2026, the lowest level since February to April 2021. ONS, 2026
- In May to July 2026 there were 2.5 unemployed people per UK vacancy, unchanged since July to September 2025. ONS, 2026
What it means for hiring managers: With 2.5 to 3.0 unemployed people per vacancy in the UK and Canada, expect plenty of applications. The effort goes into screening for proven selling history.
Filling a role takes a median 39 days, and a sales hire takes nearly three months to reach a first call
Two different clocks are in play. SHRM measures time to fill for any non-executive role. SalesFuel asks sales managers how long hiring takes before the new rep makes a first sales call. They come from different studies, so do not add them together.
- 39 days is the median time to fill a non-executive role in 2026, across all non-executive roles rather than sales roles specifically. SHRM, 2026
- 97% of non-executive positions were filled externally in 2026, up from 93% in 2025. SHRM, 2026
- Companies typically spend nearly 3 months hiring a sales rep before that person makes a first sales call (SalesFuel does not state its sample size). SalesFuel, 2026
- $5,475 is the average cost per hire for non-executive roles. Filling a seat costs far less than replacing a hire who fails. SHRM, 2025
- $35,879 is the average cost per hire for executive roles, about six and a half times the non-executive figure (derived). SHRM, 2025
What it means for hiring managers: Plan the search around the longer, sales-specific number, nearly three months, not the 39-day all-roles median. The average cost per hire is $5,475 for a non-executive role, which is small next to what a failed sales hire is estimated to cost (next section).
Most employed professionals are open to a recruiter, but the best data on it is from 2014
LinkedIn’s 2014 survey of 18,000 employed professionals in 26 countries is still the most cited split of active and passive candidates. It is 12 years old, so treat it as the rough shape of the market rather than a current count. Only the AE experience requirement below is from 2026.
- 85% of fully employed professionals are either active job seekers or open to hearing from a recruiter. LinkedIn builds the 85% from 25% active, 45% passive and open when a recruiter approaches, and 15% passive but quietly starting to talk to their network. Older data LinkedIn Talent Solutions, 2014
- 25% describe themselves as actively looking for a new job. Older data LinkedIn Talent Solutions, 2014
- 45% are passive but open to considering a new opportunity when a recruiter approaches them, the largest group in the market. Older data LinkedIn Talent Solutions, 2014
- 15% are passive and “surreptitiously starting to talk to their network”, in LinkedIn’s wording. Counting only the 25% and 45% groups gives 70%; this group makes up the rest of the 85%. Older data LinkedIn Talent Solutions, 2014
- 15% are “super-passive”, happy in their role and not interested in talking. Older data LinkedIn Talent Solutions, 2014
- 20% were super-passive in LinkedIn’s 2012 data, against 15% in 2014, so the unreachable group shrank over those two years. Older data LinkedIn Talent Solutions, 2012
- 3.7 years of prior experience are now required at hire for AEs, up from 2.7 years in 2022. A longer requirement shrinks the pool of eligible candidates. The Bridge Group AE report, 2026
What it means for hiring managers: In LinkedIn’s 2014 data a quarter of employed professionals were actively looking and 85% were at least open to hearing from a recruiter, so a posted job reaches only part of the market. With AEs now expected to bring 3.7 years of experience (2026), the share of that pool you can actually hire is smaller. Approach passive candidates directly.
SalesFuel estimates a bad sales hire costs $177,171, and most managers still do not test sales skills
The recruiting fee is small next to the cost of a failed hire: ramp time, manager time and pipeline that never gets built.
- $177,171 is the estimated average cost of a bad B2B sales hire in the US, according to SalesFuel. It counts recruiting, pay, training and the damage to forecasts and morale. Sales & Marketing Management, 2026
- 45% of sales managers use sales-skills assessment tests to evaluate candidates. Most managers still hire without one. Sales & Marketing Management, 2026
- Just 27% of sales managers rely on pre-hire behavioural or personality assessments. Sales & Marketing Management, 2026
- Only 20% of organizations track quality of hire, so four in five never measure whether the hire worked. SHRM, 2025
What it means for hiring managers: Of all the numbers in this page, the hiring fee is among the smallest. Add a role-play, a call review or a work sample before the offer; 45% of sales managers use a sales-skills test, so most do not.
Fewer than half of account executives hit quota
Quota attainment has slipped in the latest studies, and most companies already plan for misses.
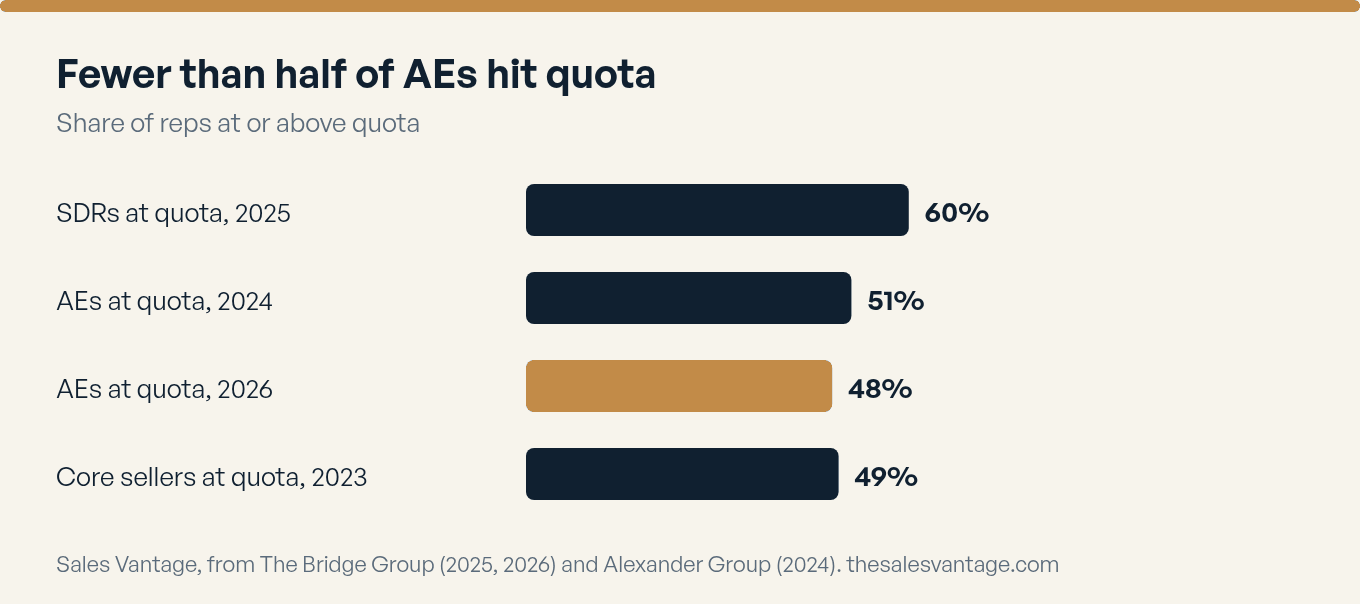
- In The Bridge Group’s 2026 study of 158 B2B companies, 48% of account executives hit annual quota, down from 51% in 2024. The Bridge Group AE report, 2026
- Only 60% of SDRs were at quota in the 2025 edition, the lowest in the study’s history. That leaves four in ten below quota (derived). The Bridge Group SDR report, 2025
- 49% of core sellers achieved quota in 2023 across 300+ companies, and companies projected 51% for 2024. A different sample from the Bridge Group’s, and the same answer: about half. Alexander Group, 2023
- The median AE quota is $960K. The Bridge Group AE report, 2026
- 4.6x median quota-to-OTE ratio, up from 4.2x in 2024. Reps are being asked to sell more for each dollar of pay. The Bridge Group AE report, 2026
- In Xactly’s survey, 44% of respondents plan for fewer than 70% of their AEs to achieve quota. Xactly, 2024
- Xactly’s press release says 91% of the companies responding do not expect their AEs to meet or exceed quota. Planning for misses is standard practice. Xactly, 2024
- 57% of reps hit quota at companies in the highest AI-engagement tercile (observational data). Companies using AI more broadly show better attainment, though the data cannot prove cause. The Bridge Group AE report, 2026
- 39% of reps hit quota at companies in the lowest AI-engagement tercile, 18 points below the top tercile (derived). The Bridge Group AE report, 2026
What it means for hiring managers: A plan that assumes every AE makes quota will miss when about half of them do. Ask each finalist for three years of attainment and the size of the quota behind it, then build capacity on the typical rep, not the best one.
A new AE takes six months to ramp, and the clock starts before day one
Add the hiring process and a single seat can be under-producing for most of a year.
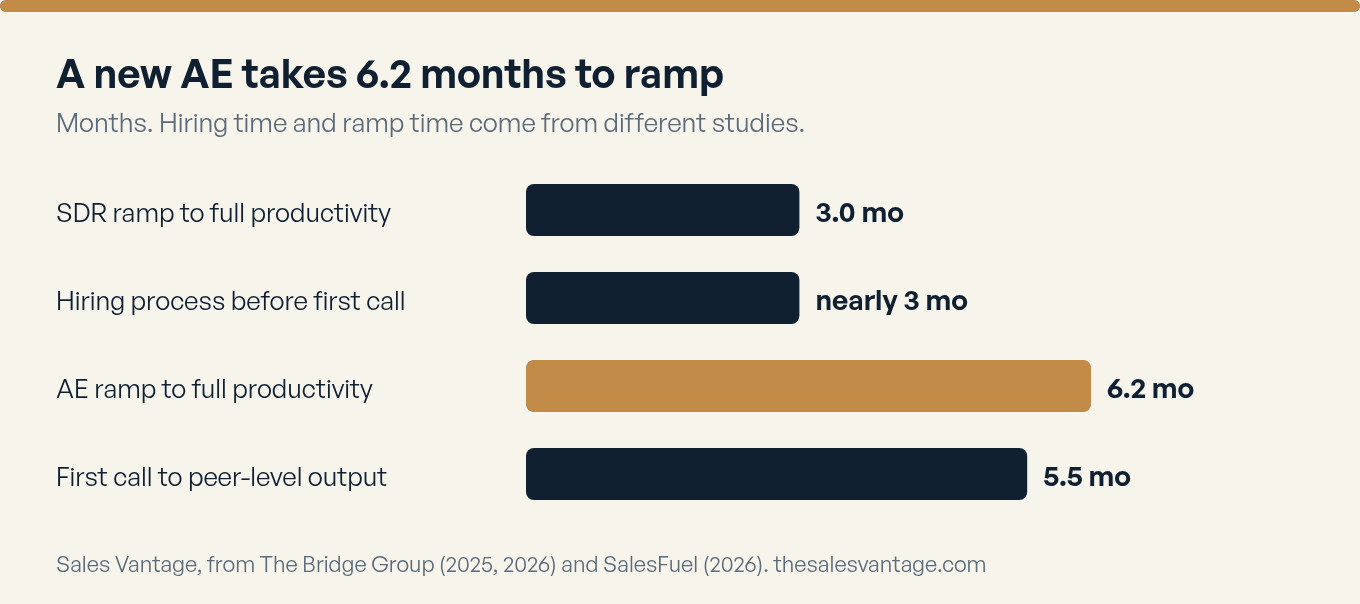
- The average AE takes 6.2 months to reach full productivity, the highest in the study’s history. The Bridge Group AE report, 2026
- 3.0 months is the average SDR ramp, the lowest since 2010 (the peak was 3.8 months in 2014). That is about half the AE ramp. The Bridge Group SDR report, 2025
- 5.5 months is how long managers say a new rep needs after the first call to match the output of the rest of the team, in SalesFuel’s Voice of the Sales Manager survey. Add the hiring time and a seat can stay under-productive for most of a year. SalesFuel, 2026
- 77% of respondents report a new-hire AE ramp period of six months or less. Xactly, 2024
- 47% of companies expect at least 10% of new AEs not to last through the ramp period. Xactly full report, 2024
What it means for hiring managers: With an average AE ramp of 6.2 months and nearly three months of hiring before it starts, a wrong hire can cost most of a year before anyone is sure. Ask finalists how long their last ramp took and what they sold in month three, then check it with a reference.
What reps say about coaching and enablement
Salesforce surveyed 4,050 sales professionals in 22 countries in August and September 2025 and published the results in February 2026.
- Three in four reps (75%) say they are more likely to hit their targets with a coach or mentor. Salesforce State of Sales, 2026
- 52% of reps say traditional enablement does not give them the skills they need. Salesforce State of Sales, 2026
- 46% of reps say they rarely get feedback on their sales conversations. Salesforce State of Sales, 2026
- On role-play, 41% of reps say they do not get enough chances before customer calls. Salesforce State of Sales, 2026
- 40% of reps say their manager’s lack of time is an obstacle to enablement. Salesforce State of Sales, 2026
What it means for hiring managers: Three in four reps say coaching would help them hit target, and 40% say their manager has no time for it. Before you hire, decide who will coach the new rep and when.
SDR attrition is 40%, but only 11 points of it are reps quitting
How high turnover runs depends on who you ask and which role. The split between quits, dismissals and promotions changes the story.
- Median annual SDR attrition was 40% in 2024 (the middle half of companies ran 21% to 57%). The Bridge Group SDR report, 2025
- 13% / 11% / 16% is how that 40% splits: involuntary exits, voluntary exits and promotions. Only 11 points are people quitting; 16 points are people moving up. The Bridge Group SDR report, 2025
- 34% of SDR attrition was promotions in 2020, against 16% in 2025 (derived: less than half). The Bridge Group SDR report, 2025
- 1.9 years is the average SDR tenure, the highest since the early 2010s. The Bridge Group links this to 2022-2023 layoffs and a competitive AE job market. The Bridge Group SDR report, 2025
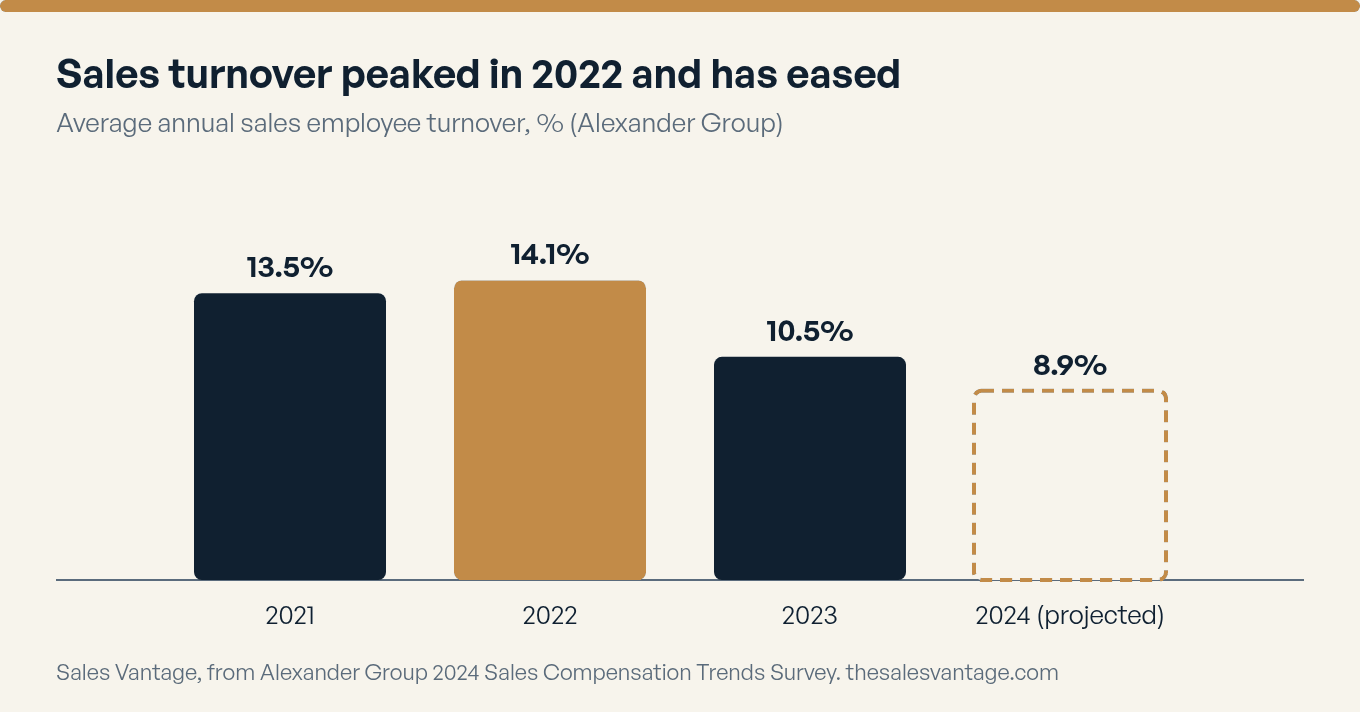
- Average sales employee turnover was 13.5% in 2021. Older data Alexander Group, 2021
- Average sales employee turnover peaked at 14.1% in 2022, the high in that dataset. Older data Alexander Group, 2022
- 10.5% average sales employee turnover in 2023, down from the 2022 peak but still above 10%. Alexander Group, 2023
- Companies projected 8.9% average sales employee turnover for 2024. Alexander Group, 2024
- 65% of 2023 sales turnover was voluntary and 35% involuntary, so about one in three exits was the employer’s decision. Alexander Group, 2023
What it means for hiring managers: Split turnover by cause before you act on it. Dismissals are the part you can trace back to the hiring decision, and in the Bridge Group data promotions were a bigger share of SDR exits than quits.
Sales pay runs well above the national median once the product gets technical
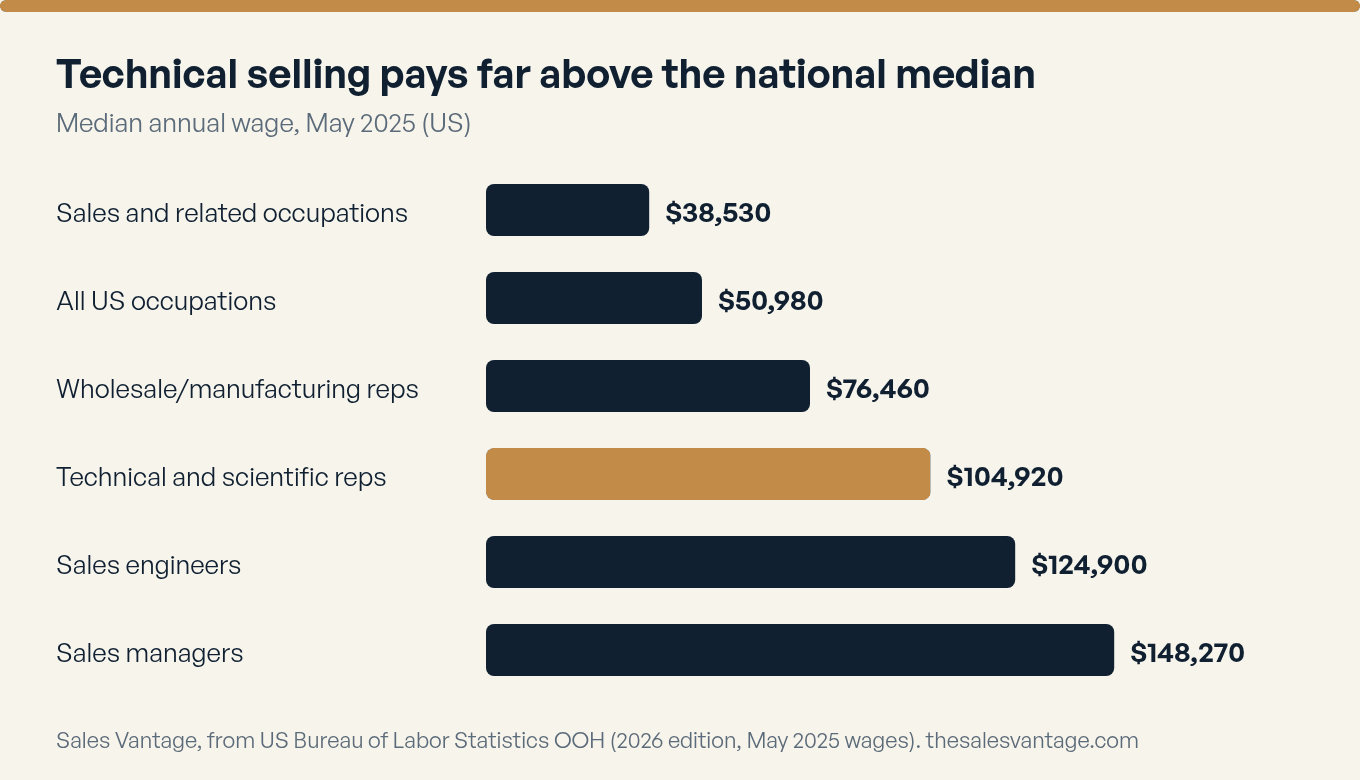
- $50,980 is the median annual wage across all US occupations (May 2025), the baseline for the comparisons below. BLS, 2025
- $38,530 is the median wage for all sales and related occupations, well below the all-job median. BLS, 2025
- $76,460 is the median wage for wholesale and manufacturing sales reps, about 50% above the all-job median (derived). BLS, 2025
- Reps who do not sell technical or scientific products have a median wage of $72,080. BLS, 2025
- $104,920 is the median wage for reps who sell technical and scientific products. Technical knowledge adds about $32,800 over the non-technical median (derived from the two BLS medians). BLS, 2025
- $200,440+ is what the top 10% of technical and scientific product reps earned, well above the median sales manager’s $148,270. BLS, 2025
- Sales engineers earn a median of $124,900. BLS, 2025
- $73,870 to $195,270 is the range from the 10th to the 90th percentile for sales engineers. Two sales engineers can be paid very differently, so benchmark the specific profile. BLS, 2025
- $148,270 is the median wage for sales managers, about three times the all-job median (derived). BLS, 2025
- The top 10% of sales managers earned $290,540+. BLS, 2025
- $200K is the median AE on-target earnings, up from $190K in 2024 and $167K in 2022. That is a rise of about 20% in four years (derived from the two reported figures). The Bridge Group AE report, 2026
- $80K is the median SDR on-target earnings, split $55K base and $25K variable. The Bridge Group SDR report, 2025
- The median SDR manager OTE is $146K, up from $127K in 2018. The Bridge Group SDR report, 2025
What it means for hiring managers: Match the offer to the right BLS occupation. A technical product rep’s median is $104,920, so an offer pitched near the all-sales median of $38,530 will not reach that person.
Manufacturing employs a fifth of sales engineers and pays technical reps $106,650
Public data on device sales specifically is thin, so the numbers below describe the closest official occupations.
- $77,280 is the median wage for non-technical sales reps working in manufacturing, slightly above the $72,080 non-technical median. BLS, 2025
- $106,650 is the median wage for technical and scientific product reps working in manufacturing. It is the closest public number to a manufacturer’s technical sales rep. BLS, 2025
- 18% of non-technical wholesale and manufacturing reps work in manufacturing. Wholesale is the largest employer and manufacturing is third. BLS, 2025
- Among technical and scientific reps, 11% work in manufacturing. BLS, 2025
- 21% of sales engineers work in manufacturing, the second-largest employer of sales engineers. BLS, 2025
- $156,150 is the median wage for sales managers in manufacturing, above the all-industry median of $148,270. BLS, 2025
- Manufacturing employs 10% of sales managers. BLS, 2025
What it means for hiring managers: Only 11% of technical and scientific product reps work in manufacturing, so the pool that matches an industrial or device seller is small. Say in the posting what the product, the buyer and the sales cycle look like, so the right person recognises the job.
A hiring scorecard built from these benchmarks
This is Sales Vantage’s own framework. It is not a statistic, no publisher above produced it, and we have not tested it in a study. It turns the benchmarks on this page into five questions to score before you make an offer.
| Criterion | What to ask for | Benchmark on this page |
|---|---|---|
| Quota attainment evidence | Three years of attainment, the quota behind each year, and how the rep ranked on the team | 48% of AEs hit quota (2026); median AE quota $960K |
| Territory quality | Whether the territory was inherited, built or shared, and how much pipeline it came with | 44% of companies plan for fewer than 70% of AEs to hit quota (Xactly, 2024) |
| Sales-cycle complexity | Deal size, number of buyers and cycle length, compared with your own | The Bridge Group ties the 6.2-month AE ramp to deal complexity and buying-committee size (2026) |
| Ramp performance | Months to a first deal and results by month three at the last employer | 6.2-month AE ramp; 5.5 months from first call to peer-level output (SalesFuel, 2026) |
| References | A former manager who can confirm attainment and ramp, not only a listed contact | Only 20% of organisations track quality of hire (SHRM, 2025) |
Score each row from 1 to 5 and weight the rows for the role. Use the same sheet to brief interviewers, to set the ramp plan, and to choose the BLS occupation for the pay check in the pay section above. If you want it applied to a live search, book a Role Intake Call.
Related context beyond hiring
These figures are about buyers, rep time, AI use and the wider manufacturing workforce. They support the hiring picture but are not hiring benchmarks, so they sit at the end.
Buyers and the buying journey
- 17% of the B2B buying journey is spent meeting with potential suppliers. Buyers do most of the work without a seller in the room. Older data Gartner buyer survey, 2017 (750 buyers)
- 5% to 6% is the share of buying time any single rep may get when buyers compare several suppliers. That is a small window, so the person in front of the buyer matters. Older data Gartner buyer survey, 2017
- 61% of B2B buyers prefer an overall rep-free buying experience (632 buyers surveyed in August and September 2024). Buyers want less contact, so each contact has to count. Gartner press release, June 2025 (survey fielded 2024)
- Among B2B buyers, 73% actively avoid suppliers who send irrelevant outreach. Gartner press release, June 2025 (survey fielded 2024)
- 69% of B2B buyers report inconsistencies between a company’s website and what its sellers tell them. Gartner press release, June 2025 (survey fielded 2024)
Rep time, pay transparency and AI
- 60% of the average rep’s workweek goes to non-selling work. That leaves about two days of a five-day week for actual selling (derived). Salesforce State of Sales, 2026
- 35% of their week is spent selling by Gen Z reps, against 40% for the average rep. Newer reps lose selling time to manual data entry. Salesforce, 2026
- On pay, 76% of reps wish there were more transparency in how their compensation is calculated. Salesforce State of Sales, 2026
- 54% of sales teams use AI agents today, and another 34% expect to within two years. Salesforce State of Sales, 2026
Manufacturing workforce outlook
- 3.8 million additional manufacturing employees could be needed between 2024 and 2033, according to the Manufacturing Institute and Deloitte. The Manufacturing Institute and Deloitte, 2024
- 1.9 million of those jobs could go unfilled if skills and applicant gaps are not addressed, which is half the projected need. The Manufacturing Institute and Deloitte, 2024
- 65% of respondents in the National Association of Manufacturers’ 2024 Q1 outlook named attracting and retaining talent their primary business challenge. The Manufacturing Institute and Deloitte, 2024
Methodology and sources
- What counts as verified. We opened the original report page, PDF, press release or government release and found the figure in it. A number repeated by a blog or aggregator did not qualify.
- Checked on October 17 and re-audited on October 18, 2026. Every figure and link was checked on the first date. On the second we re-read each source page against the wording on this page. The year next to each source is the year the data describes or was collected.
- This is a synthesis, not our research. Sales Vantage ran no survey, and nothing here comes from our placements or clients. The value is in finding the original source, checking the definition and saying what each number does and does not measure.
- Derived figures are labelled. A few lines compare two reported numbers, such as a gap between two medians. Those carry the word derived.
- SaaS-specific versus broader. The Bridge Group SDR study is 83% B2B SaaS and Xactly surveyed B2B technology and services firms. The Bridge Group AE study, Salesforce, HubSpot and SalesFuel do not publish a sector split on the pages we checked. SHRM covers all roles and industries. Alexander Group covers nine industries, including manufacturing and life sciences. BLS, Statistics Canada and ONS are national statistics. Several publishers also sell into this market.
- Older data is flagged. LinkedIn’s passive-candidate split is from 2014, Gartner’s buying-time split is from 2017 and Alexander Group’s 2021 and 2022 turnover is from before the current cycle. Each carries an Older data tag. They are still the most cited versions, and we found no newer primary source.
- Correlation, not cause. The AI-engagement and quota gap in the Bridge Group data is observational, and the authors say so.
- Postings data is a sample. PredictLeads counts job postings it can crawl, and its figures here cover a single 30-day window (7 August to 5 September 2026) against the 30 days before. Treat them as a snapshot, not a trend.
- What we left out. We dropped figures we could only find on secondary sites or behind a login, including a DePaul University estimate of replacement cost, RAIN Group’s top-performer ratios and RepVue’s medical device quota data. We also dropped Xactly’s statement that 9% of respondents plan for more than 90% of AEs to hit quota, because the chart beside it in the same report shows 3% in that band. If you can point us to the primary page for any of them, we will add it.
- Who wrote this. Himanshu Khantwal founded Sales Vantage. His own experience is selling (SDR and closer roles), and he writes about hiring from the sales side. Sales Vantage is a recruiting firm, so we have an interest in good hiring data.
All sources
Update log
- October 19, 2026. Added a link to Sales Compensation Statistics 2026 in the pay section.
- October 18, 2026. Replaced the LinkedIn 85% line with the full split (25% + 45% + 15% = 85%, plus 15% super-passive). Removed Xactly’s 9% figure, which its own chart does not support. Relabelled Gartner’s June 2025 release as a survey fielded in 2024. Put hiring demand, time to fill, cost and sourcing first and moved buyer, AI and manufacturing-workforce data to a context section at the end. Added a summary table, a reading guide and a hiring scorecard. Aligned the publication date and author name.
- October 17, 2026. Corrected the 2012 versus 2014 LinkedIn comparison, the 0% versus job-loss wording, the Canadian unemployment-to-vacancy wording and the postings-data framing.
- October 16, 2026. First published.
Cite or embed this page
You are welcome to quote any statistic here and to use the charts, free, with a link back to this page. Please also credit the original publisher shown next to each number.
Suggested citation
Khantwal, H. (2026, October 16; updated 2026, October 19). Sales Hiring Statistics 2026: 110 Verified Data Points on Quota, Ramp, Turnover and Pay. Sales Vantage. https://thesalesvantage.com/blog/sales-hiring-statistics/
Credit line for charts
<a href="https://thesalesvantage.com/blog/sales-hiring-statistics/">Source: Sales Vantage, Sales Hiring Statistics 2026</a>
Found a number that has been updated, or a source we missed? Email contact@thesalesvantage.com and we will check it.
Frequently asked questions
In The Bridge Group’s 2026 study of 158 B2B companies, 48% of account executives hit annual quota, down from 51% in 2024. In its 2025 SDR study, 60% of SDRs were at quota, the lowest on record. An Alexander Group survey of 300+ companies found 49% of core sellers achieved quota in 2023. The samples differ, but all three point to roughly half.
The Bridge Group reports an average AE ramp of 6.2 months in 2026, the longest in its history, and an average SDR ramp of 3.0 months in 2025. SalesFuel’s research adds that companies typically spend nearly three months hiring before the rep’s first sales call, then another 5.5 months to reach peer-level productivity.
SalesFuel estimates the average cost of a bad B2B sales hire in the US at $177,171. It says the figure includes recruiting, compensation and training, plus harder-to-count costs such as missed forecasts and lower morale. It is an estimate, and other methods give other numbers, but it is the most recent one we could trace to a primary source.
It depends on the role and the sample. The Bridge Group reports median SDR attrition of 40% in 2024, made up of 13% involuntary exits, 11% voluntary quits and 16% promotions. The Alexander Group reports average sales employee turnover of 10.5% in 2023, with 65% of it voluntary.
BLS reports median annual wages for May 2025 of $76,460 for wholesale and manufacturing sales representatives, $104,920 for those selling technical and scientific products, $124,900 for sales engineers and $148,270 for sales managers. The median for all US occupations was $50,980.
Public, primary-source data is thin. The closest official numbers are the BLS figures for technical and scientific product reps and sales engineers, plus The Manufacturing Institute and Deloitte’s projection that US manufacturing could need as many as 3.8 million additional employees between 2024 and 2033. We left out medical-device figures we could only find on secondary sites.
Hiring a salesperson?
Sales Vantage recruits salespeople and sales leaders across most industries in the US, UK and Canada, with manufacturing and medical devices as our lead specialty. You pay only if you hire, and every placement carries a 90-day replacement guarantee on the terms in our client agreement.